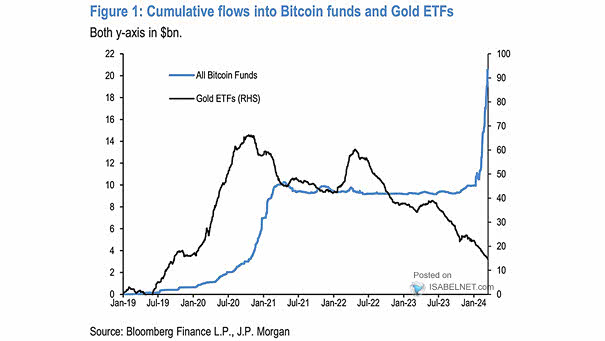
Net Monthly Flows of U.S. Spot Bitcoin ETFs

Net Monthly Flows of U.S. Spot Bitcoin ETFs Since the reversal in October 2025, institutions have cut billions in Bitcoin holdings month after month, an indication of fading appetite and a darker mood across crypto markets. Image: Deutsche Bank Research

Bitcoin, Gold and S&P 500’s Performance

Bitcoin, Gold and S&P 500’s Performance Bitcoin has lost some ground lately, but at about 370% above its early‑2023 lows, it looks less like a speculative bet and more like a market finding its footing. Image: Deutsche Bank Research

Bitcoin Drawdown

Bitcoin Drawdown Volatility persists, but Bitcoin’s drop of more than 40% from its October peak looks more like a typical correction than a structural breakdown. In most markets that would be a crash; for Bitcoin, it’s business as usual Image: Bloomberg

Monthly Net Flow to U.S. Bitcoin ETFs

Monthly Net Flow to U.S. Bitcoin ETFs Bitcoin has dropped over 30% since its October 2025 peak, a slide deepening in a market still pressured by relentless ETF outflows. But for crypto veterans, this kind of turbulence is just part of the ride. Image: Bloomberg

Gold vs. Bitcoin

Gold vs. Bitcoin The gap between gold and bitcoin has widened in recent weeks. Safe‑haven flows have lifted gold, while bitcoin has been trading more like a high‑beta risk asset, closely tracking tech and growth stocks. Image: MarketDesk Research

Bitcoin Price and Moving Averages

Bitcoin Price and Moving Averages Bitcoin’s recovery above its 50-day moving average after sharp drops like the one in early October 2025 typically signals the start of a potential reversal or at least a move toward steadier ground. Image: Bloomberg

Bitcoin Annual Returns

Bitcoin Annual Returns Bitcoin is sliding toward a year of losses, and this one comes without the usual chaos. No fraud, no implosion, just a quieter, more mature market learning that pain isn’t always tied to panic. Image: Bloomberg

S&P 500 vs. Bitcoin

S&P 500 vs. Bitcoin Bitcoin usually tracks risk assets like equities, but in 2025 it broke away from the U.S. stock rally, surprising traders who expected a lift from President Donald Trump’s pro‑crypto stance and growing institutional interest. Image: Bloomberg

Ratio of Bitcoin to Production Cost

Ratio of Bitcoin to Production Cost Bitcoin slipped below JPMorgan’s estimated production cost of $94,000 for the first time since mid-2020, a level that has often marked the price floor in earlier cycles. Even so, the bank remains optimistic on Bitcoin’s potential. Image: J.P. Morgan

Bitcoin-Nasdaq 100 30-Day Correlation

Bitcoin-Nasdaq 100 30-Day Correlation Bitcoin’s correlation with the Nasdaq 100 has surged to multi-year highs, but as macro conditions shift and the crypto market matures, its link to traditional equities could start to loosen. Image: Bloomberg

Bitcoin Price and 365-Day Moving Average

Bitcoin Price and 365-Day Moving Average A break below the 365-day moving average puts Bitcoin on the defensive. Add in thin dip demand, margin pressure, and souring sentiment, and the setup looks ripe for institutional players to stay sidelined until clarity emerges. Image: Bloomberg