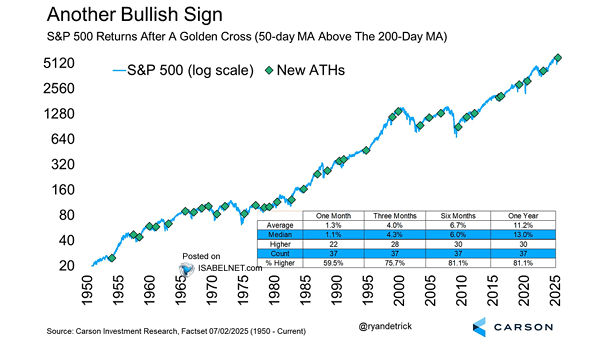
Gold vs. Other Asset Total Returns

Gold vs. Other Asset Total Returns A performance rotation from stocks to gold is emerging. This may signal the beginning of a broader shift, as Trump’s efforts to weaken the dollar and lower rates coincide with a deteriorating outlook for equities. Image: Topdown Charts

Gold 10-Day Rolling Returns

Gold 10-Day Rolling Returns Given the exceptionally high 10-day rolling return and overbought technical signals, a short-term pullback in gold prices would not be surprising. Image: The Daily Shot

S&P 500 Forward P/E Ratio and Subsequent 5-Year Returns

Forward P/E Ratio and Subsequent 5-Year Annualized Returns Considering the valuation of the U.S. stock market, investors may need to adjust their expectations for equity returns, which are likely to be lower in the coming five years. Image: J.P. Morgan Asset Management

Two-Day Returns for the S&P 500

Two-Day Returns for the S&P 500 The clustering of best and worst days underscores the importance of patience and discipline in investing. Selling after the worst days often means missing the best days that follow! Image: Carson Investment Research

Indexed S&P 500 Return – Market Hours vs. Overnight

Indexed S&P 500 Return – Market Hours vs. Overnight Overnight trading sessions account for almost all of the S&P 500’s recent downturn, overshadowing activity during normal U.S. trading hours. Image: Deutsche Bank Asset Allocation

Median 2-Week S&P 500 Returns

Median 2-Week S&P 500 Returns Bulls have reason to be optimistic, as the S&P 500 has historically delivered strong positive performance during the final two weeks of April since 1950. Image: Goldman Sachs Global Investment Research

MSCI AC World Calendar Year Returns vs. Intra-Year Declines

MSCI AC World Calendar Year Returns vs. Intra-Year Declines Despite median intra-year drops of 15%, the global equity index ended positively in 34 of the past 45 years—highlighting the value of long-term investing over reacting to short-term volatility. Image: Goldman Sachs Global Investment Research

Sensitivity of S&P 500 Returns to EPS and P/E Scenario

Sensitivity of S&P 500 Returns to EPS and P/E Scenario Goldman Sachs projects S&P 500 EPS at $253 for 2025, driven by economic slowdowns, tariff pressures, and inflationary risks. Image: Goldman Sachs Global Investment Research

The 15 Worst Q1 Returns for the S&P 500 and What Happened Next

The 15 Worst Q1 Returns for the S&P 500 and What Happened Next A weak Q1 for the S&P 500 often sets the tone for lackluster performance in the remaining quarters, with data showing a median return of just 3.0% for the final three quarters. Image: Carson Investment Research