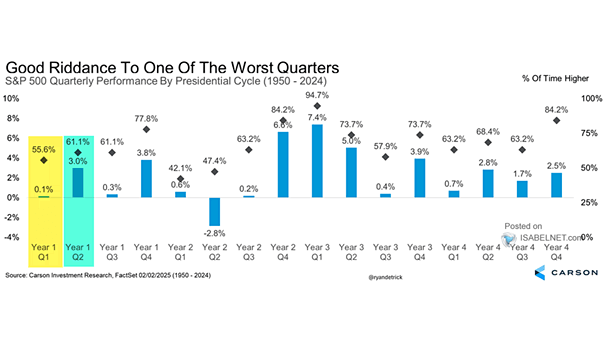
S&P 500 Total Return Index (Real Annual Returns)
S&P 500 Total Return Index (Real Annual Returns) The real S&P 500 is on course for the worst annual drop since 1974. Image: BofA Global Investment Strategy
World Government Bond GDP-Weighted Return Index Global government bond markets are on course for the worst year since 1920. Image: BofA Global Investment Strategy
Pullbacks and Returns a Year Off the Lows for the S&P 500 Index Based on the 4-Year Presidential Cycle Historically, the S&P 500 average intra-year pullback from peak to trough has been more than 17% in midterm years. Image: LPL Research
S&P 500 Total Return Valuations Despite the recent sell-off, the valuation of the S&P 500 remains at high levels by historical standards. Image: Real Investment Advice
S&P 500 Index Returns Final 3 Days of a Month After Horrible Starts Can U.S. equity investors expect a bounce in the final three days of this month? Image: LPL Research
Indexed Return of Value vs. Growth vs. U.S. Financial Conditions Should investors still favor value over growth stocks? Image: Goldman Sachs Global Investment Research
Probability of Negative Returns, Based on S&P 500 Total Returns from 1929-Present Historically, lengthening one’s time horizon has been one approach to reducing losses. Image: BofA US Equity & Quant Strategy
S&P 500 Return Seasonality and Tax Day Historically, U.S. stocks tend to rally in the two-week period after tax day. Image: J.P. Morgan
Indexed Return of Cyclicals vs. Defensives ex. Commodities and ISM Manufacturing Index Are investors bracing for a looming economic slowdown? Image: Goldman Sachs Global Investment Research
Returns – 20+ Year Treasury Bond ETF Drawdown Should investors consider long-maturity Treasuries after the market selloff? Image: The Daily Shot