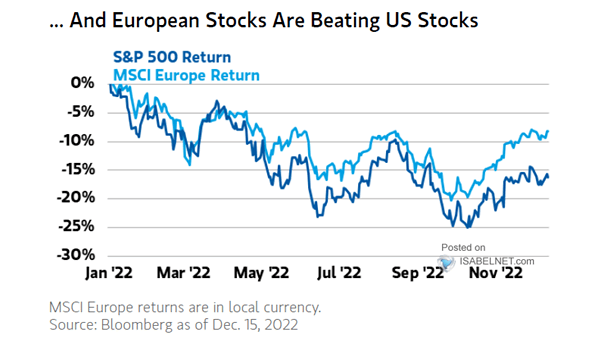
S&P 500 Industry Group Return Macro Correlations
S&P 500 Industry Group Return Macro Correlations Should investors still favor defensive value? Image: Stifel
Return – U.S. ISM Manufacturing Index vs. U.S. Treasuries Could U.S. Treasuries represent a buying opportunity? Image: True Insights
Average S&P 500 6-Month Return Should investors ignore the old adage “sell in May and go away?” Image: Goldman Sachs Global Investment Research
Sentiment – 52-Week S&P 500 Forward Return and AAII Survey Bulls Minus Bears Investor sentiment remains very bearish, which is contrarian bullish. Image: Richardson Wealth
S&P 500 Index Returns YTD at the End of April Will the rest of the year be much better than average for the S&P 500? Image: LPL Research
S&P 500 Total Return Index (Real Annual Returns) The real S&P 500 is on course for the worst annual drop since 1974. Image: BofA Global Investment Strategy
Pullbacks and Returns a Year Off the Lows for the S&P 500 Index Based on the 4-Year Presidential Cycle Historically, the S&P 500 average intra-year pullback from peak to trough has been more than 17% in midterm years. Image: LPL Research
S&P 500 Total Return Valuations Despite the recent sell-off, the valuation of the S&P 500 remains at high levels by historical standards. Image: Real Investment Advice
S&P 500 Index Returns Final 3 Days of a Month After Horrible Starts Can U.S. equity investors expect a bounce in the final three days of this month? Image: LPL Research
Indexed Return of Value vs. Growth vs. U.S. Financial Conditions Should investors still favor value over growth stocks? Image: Goldman Sachs Global Investment Research