VIX – Volatility Index
VIX – Volatility Index While a low VIX may indicate a relatively stable market environment, it can also be a sign of complacency or a lack of market participants’ concern about potential risks. Image: The Daily Shot
Bond Volatility – MOVE Index The decline in U.S. Treasury bond market volatility is seen as good news because it indicates a more stable and predictable investment environment, which can benefit both individual investors and the broader economy. Image: The Daily Shot
Volatility – U.S. Options Expiration
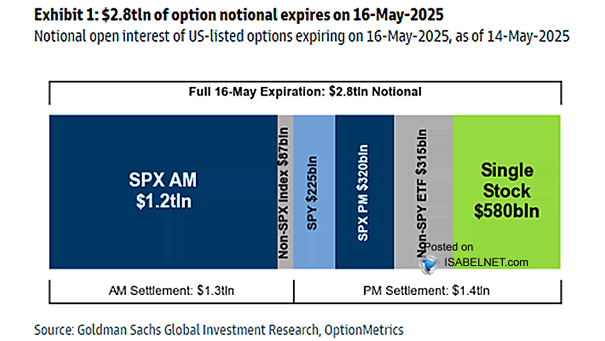
 Today being the largest September-options-expiration on record could suggest potentially significant market movements. Image: Goldman Sachs Global Investment Research
Volatilty – VIX Level Should U.S. equity investors expect more volatility ahead? Image: Goldman Sachs Global Investment Research
Volatility – VIX/MOVE Ratio The VIX/MOVE ratio is still falling. Image: The Daily Shot
Would You Rather Be Long or Short S&P 500 Volatility at the Moment? 73% of JPM clients prefer to be long S&P 500 volatility right now. Image: J.P. Morgan
Gold – Beta of USD/xxx to Equity Market Volatility Related to Government Spending Gold has been a very good hedge against debt ceiling worries in the past. Image: Deutsche Bank
Equity Market Volatility Related to Uncertainty over Government Spending Equity market volatility may spike when the debt ceiling is under discussion. Image: Deutsche Bank
S&P 500 Realized Volatility Around Previous Recession Start U.S. equity volatility looks attractive. Image: J.P. Morgan
Volatility – S&P 500 vs. 12-Month Count of Daily Changes of -1% or Lower Is this the end of the bear market, as volatility has peaked? Image: Topdown Charts