Volatility – VIX Curve and U.S. Election

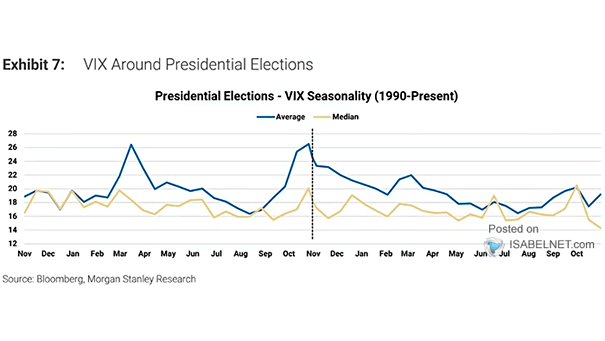
Volatility – VIX and U.S. Election The historical trend of the VIX spiking before U.S. elections and then rapidly declining afterward can be attributed to heightened uncertainty and investor fear in the lead-up to the elections. Image: Morgan Stanley Research

Average Monthly Volatility for U.S. Election Years Since 1928

Average Monthly Volatility for U.S. Election Years Since 1928 The historical pattern of the VIX rising before U.S. elections and then rapidly plunging afterward is attributed to increased uncertainty and investor fear leading up to the elections. Image: BofA US Equity & Quant Strategy

Gold Annualized Returns and Volatility

Gold Annualized Returns and Volatility While gold has had periods of significant growth and can serve as a hedge against inflation, historical data suggests that equities have generally outperformed gold over the long term. Image: J.P. Morgan

Volatility Divergence – VIX vs. MOVE

Volatility Divergence – VIX vs. MOVE The divergence between VIX and MOVE presents unique challenges and opportunities for market participants, reflecting different expectations and perceptions of risk in the equity and bond markets. Image: BofA Global Research

S&P 500 Realized Volatility During Recession

S&P 500 Realized Volatility During Recession During recessions, there is often increased uncertainty and risk aversion among investors, which can lead to higher levels of volatility in the U.S. stock market. Image: BofA Global Research