U.S. Excess Liquidity Leads U.S. PMI
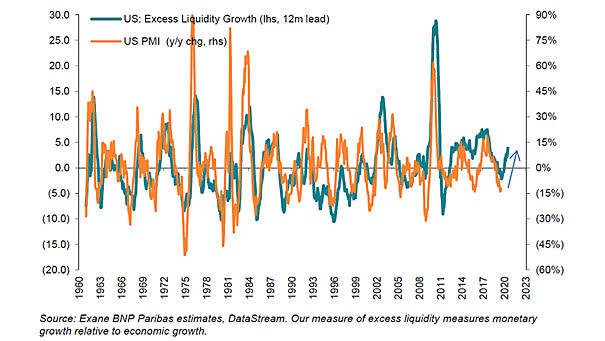
U.S. Excess Liquidity Leads U.S. PMI This chart suggests that U.S. excess liquidity leads U.S. PMI by 12 months. U.S. PMI could bounce back in 2020. Image: Exane BNP Paribas
U.S. Excess Liquidity Leads U.S. PMI This chart suggests that U.S. excess liquidity leads U.S. PMI by 12 months. U.S. PMI could bounce back in 2020. Image: Exane BNP Paribas
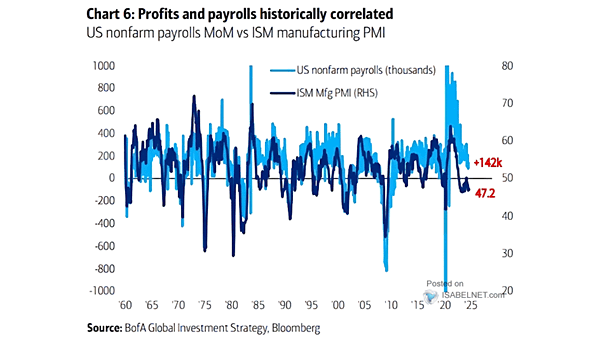
U.S. Nonfarm Payrolls vs. U.S. ISM Manufacturing PMI The U.S. ISM manufacturing index reading below 50 signals a contraction in manufacturing activity, which may impact payroll numbers. However, the relationship between the index and actual payroll figures is not straightforward. Image: BofA Global Investment Strategy

U.S. ISM Manufacturing PMI vs. 10-Year U.S. Treasury Yield Easing rate pressure is projected to facilitate a recovery in U.S. manufacturing as financial conditions improve, inflation declines, and both domestic and foreign demand strengthen. Image: BofA US Equity & Quant Strategy
ISM Manufacturing PMI and U.S. Recessions A drop in the U.S. ISM Manufacturing PMI below 45 signals significantly heightened recession risks, indicating a severe contraction in the manufacturing sector. Image: BofA Global Research
U.S. Consumer Prices Index vs. U.S. Composite PMI Input Prices (Leading Indicator) U.S. Composite PMI Input Prices tend to lead U.S. CPI by 6 months, reflecting the impact of changes in input prices on consumer prices over time. Image: Charles Schwab
U.S. ISM Manufacturing PMI vs. S&P 500 EPS Growth A rise in the U.S. ISM manufacturing PMI is suggesting positive growth in 1Q EPS, with expectations of outperforming the initial projections. Image: BofA US Equity & Quant Strategy
U.S. Dollar Index (DXY) vs. Manufacturing PMI (U.S. Minus Global Ex-U.S.) Will the U.S. dollar continue to weaken? Image: BCA Research
S&P 500 Price Returns Based on U.S. ISM Manufacturing PMI Levels The U.S. ISM Manufacturing PMI between 45 and 50 is historically bullish for U.S. stocks over the next 12 months. Image: MarketDesk Research
Nominal Effective U.S. Dollar and China Manufacturing PMI China’s rising manufacturing PMI is bearish for the U.S. dollar. Image: Alpine Macro
Philadelphia Fed Manufacturing Index vs. U.S. ISM Manufacturing PMI The Philly Fed Manufacturing Index could lead to a further dip in the ISM Manufacturing PMI. Image: The Daily Shot
Conference Board U.S. Leading Economic Index vs. ISM Manufacturing New Orders vs. ISM Manufacturing PMI The current reading of the U.S. LEI could result in lower ISM in the next few months. Image: Morgan Stanley Wealth Management