U.S. S&P Composite PMI and GDP
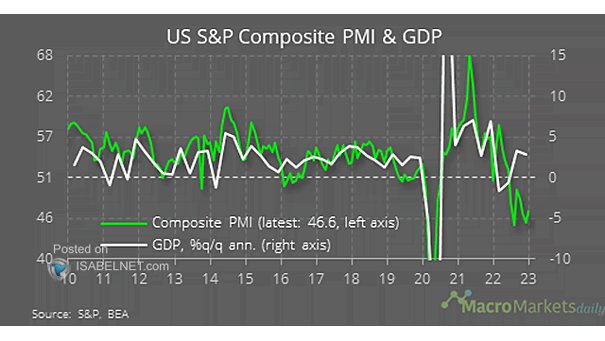
U.S. S&P Composite PMI and GDP The U.S. S&P Composite PMI suggests that the U.S. economy could be headed for a period of contraction. Image: Macro Markets Daily
U.S. S&P Composite PMI and GDP The U.S. S&P Composite PMI suggests that the U.S. economy could be headed for a period of contraction. Image: Macro Markets Daily
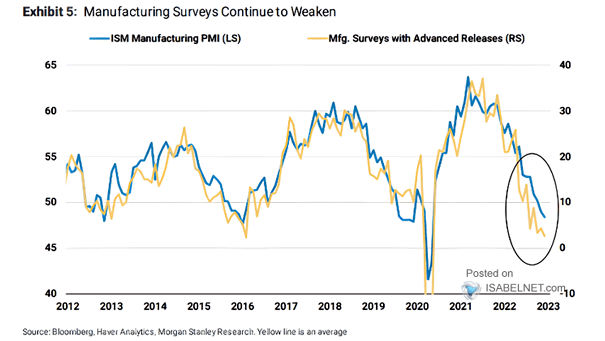
U.S. ISM Manufacturing PMI vs. Manufacturing Surveys with Advanced Releases Will the U.S. manufacturing sector struggle to recover in the near-term? Image: Morgan Stanley Research

U.S. ISM Manufacturing PMI vs. Philly Fed Futures Orders (Leading Indicator) Will the ISM Manufacturing PMI fall further, as a recession is looming in the United States? Image: Topdown Charts
Inflation – U.S. ISM Services PMI vs. U.S. CPI The ISM Services PMI tends to lead U.S. CPI by three months. Image: Morgan Stanley Research
U.S. Recessions and ISM Services PMI The ISM Services PMI below 50 is a warning signal of a coming recession in the United States. Image: Morgan Stanley Research
U.S. ISM Manufacturing PMI vs. Philadelphia Fed General Activity vs. U.S. Empire State Manufacturing Survey Regional business activity surveys suggest a lower ISM Manufacturing PMI over the coming months. Image: Morgan Stanley Research
U.S. ISM Services PMI The U.S. ISM Services Index came in much higher than expected in November. Could the Fed be more hawkish? Image: The Daily Shot
U.S. ISM Manufacturing PMI vs. Growth Tax (Leading Indicator) Should investors expect a sharp contraction of the U.S. economy? Image: Alpine Macro
Inflation – U.S. Core CPI vs. ISM Manufacturing PMI (Leading Indicator) The U.S. ISM Manufacturing PMI tends to lead U.S. core CPI by 12 months. Image: BCA Research
U.S. 10-Year Treasury Yield and Global Manufacturing PMI (Leading Indicator) Should investors prepare for a substantial decline in the global economy? Image: TS Lombard