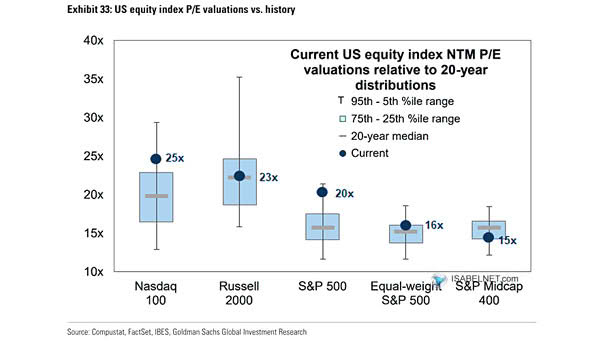
U.S. Equity Index P/E Valuations vs. History
U.S. Equity Index P/E Valuations vs. History The S&P 500’s forward P/E of about 22x suggests optimism; however, it also points to greater risk, since the market is increasingly sensitive to any earnings shortfalls or macroeconomic challenges ahead. Image: Goldman Sachs Global Investment Research