S&P 500 Performance After a >10% Quarter
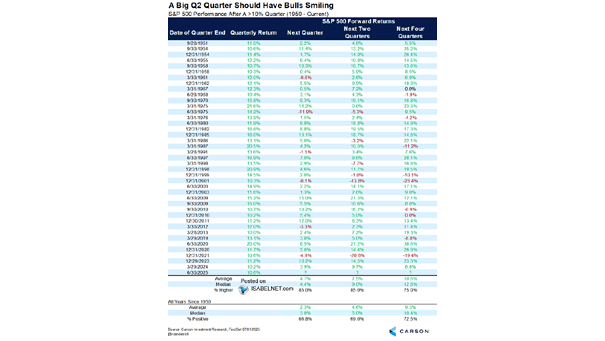
S&P 500 Performance After a >10% Quarter Since 1950, when a quarter’s return exceeds 10%, the next quarter typically performs better than average—gaining 4.7% on average compared to the overall average of 2.3%, and posting gains 85% of the time. Image: Carson Investment Research