FedEx vs. World Trade
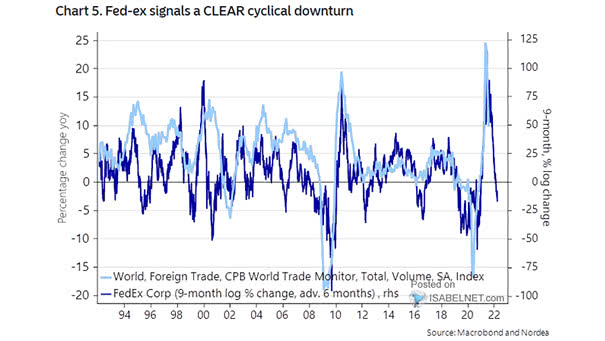
FedEx vs. World Trade (Leading Indicator) Fedex tends to lead world trade by 6 months. Image: Nordea and Macrobond
FedEx vs. World Trade (Leading Indicator) Fedex tends to lead world trade by 6 months. Image: Nordea and Macrobond
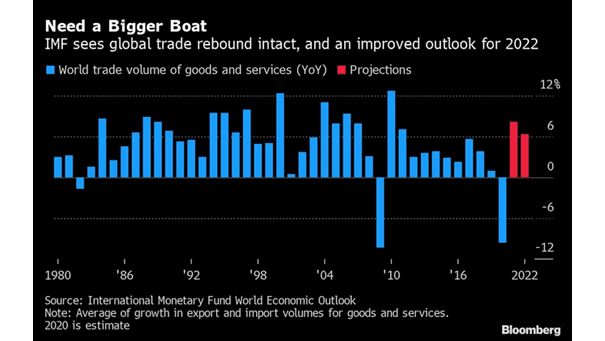
World Trade Volume of Goods and Services The International Monetary Fund expects global trade to rebound in 2021 and 2022. Image: Bloomberg

World Trade Volume Proxy World trade has rebounded faster than after the financial crisis of 2008, and is now pre-Covid-19 levels. Image: Morgan Stanley Research
World Trade Volume Index World trade is rebounding faster than it did after the financial crisis of 2008. Image: The Wall Street Journal
World Trade Growth Since 1990 In 2019, world trade growth fell to its lowest level since the global financial crisis. Image: Haver Analytics
World Trade and Copper Chart suggesting that any improvement in world trade should benefit copper. Image: BofA Global Research
World Trade Growth Chart showing that world trade growth is now at its lowest level since 2009. Image: BofA Merrill Lynch
Currency Sensitivity vs. World Trade Growth CAD and GBP are the most sensitive currencies in G10 space to world trade growth. Image: Nordea and Macrobond
U.S. Household Debt and World Trade This chart shows the pretty good correlation between U.S. household debt and world trade. Image: Oxford Economics, Macrobond
S&P 500 Forward EPS and World Trade Growth The chart shows a pretty good correlation between the S&P 500 forward 12-month EPS and the CPB World Trade Index. Image: Oxford Economics, Macrobond
China Credit Impulse Leads World Trade The chart suggests that China credit impulse leads world trade by 12 months. World trade is expected to turn positive in coming months. Credit impulse is the change in new credit issued as a percentage of GDP. Image: Oxford Economics, Macrobond