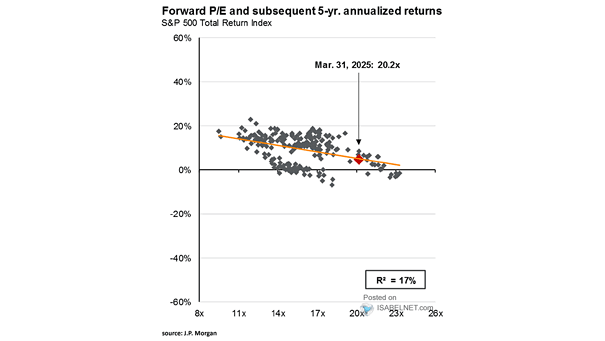
S&P 500 Forward P/E Ratio and Subsequent 5-Year Returns

Forward P/E Ratio and Subsequent 5-Year Annualized Returns With U.S. stocks still trading at lofty valuations, the next five years could bring slimmer returns. Great companies, yes! But not at great prices. Even the best businesses can disappoint if you overpay. Image: J.P. Morgan Asset Management

Non-Financial Corporate Profits vs. 5-Year Average

Non-Financial Corporate Profits vs. 5-Year Average U.S. corporate profits have surged since the COVID-19 pandemic, far outpacing the real economy. Past cycles warn that such imbalances eventually correct when market sentiment shifts. Image: Real Investment Advice

5-Year Turnover of S&P 500 Constituents

5-Year Turnover of S&P 500 Constituents In a typical five-year stretch, about 20% of S&P 500 members turn over, a reminder of how tough it is to stay in the game for the long haul. Image: Goldman Sachs Global Investment Research

25-Year Cumulative Return of S&P 500 over Gold

25-Year Cumulative Return of S&P 500 over Gold Warren Buffett has a skeptical view of gold as an investment, but apparently, gold didn’t get the memo and has been outperforming the S&P 500 over the past 25 years! Image: Deutsche Bank

5-Year U.S. Treasury Yield vs. Bank Stocks Correlation

5-Year U.S. Treasury Yield vs. Bank Stocks Correlation The combination of higher bond yields and rising bank stocks is often often viewed as a sign of a bullish market environment. Image: BofA Global Investment Strategy