Financial Stocks vs. Financial Bonds and 5-Year U.S. Treasury Bond
Financial Stocks vs. Financial Bonds and 5-Year U.S. Treasury Bond Financial stock outperformance tends to track 5-year rates. Image: BofA Global Investment Strategy
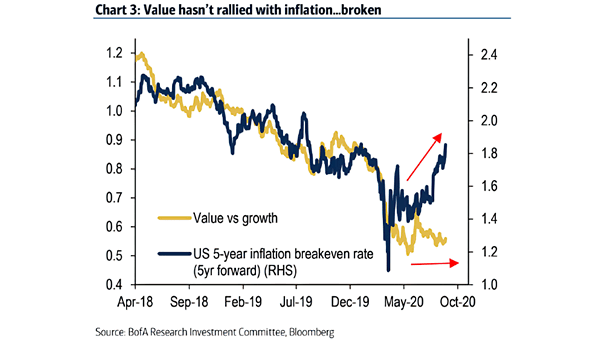
Value vs. Growth Stocks and U.S. 5-Year Inflation Breakeven Rate According to BofA, value stocks are broken after the worst performance relative to growth over a 10-year period. Image: BofA Research Investment Committee
Yield Curve – Difference 5-Year and 30-Year Treasury Yields The yield curve steepens after the Fed pivot. Are Gold prices at risk? Image: Financial Times
Gold Price and Forecast 5-Year Real Rates Goldman Sachs expects U.S. real rates to continue to fall, and raised its 12-month forecast on gold to $2000/toz. Image: Goldman Sachs Global Investment Research
Relative Performance of Bank Shares vs. Index and 5-Year Treasury Yield This chart suggests the relationship between interest rates and relative bank performance. Image: BofA Global Investment Strategy
5-Year TIPS Yield (U.S. Real Rates) vs. Gold Generally, when the U.S. 5-year TIPS yield goes down, gold tends to up. Image: The Daily Shot
Emerging Market Price-to-Book and Subsequent 5-Year Returns This chart shows the correlation between EM price-to-book and subsequent 5-year returns, suggesting higher returns for emerging markets. Image: J.P. Morgan
The U.S. Dollar’s 15-Year Cycles The chart suggests that the cycle in U.S. dollar from peak to peak is about 15 years on average. Image: Financial Times
Brent 5-Year Futures Price This chart shows that long-dated oil prices stayed relatively flat after attacks on Saudi Arabia’s oil infrastructure. Image: Goldman Sachs Global Investment Research
Chinese 5-Year Benchmark Yield Leads Global Manufacturing PMI Great chart suggesting that the Chinese 5-year benchmark yield leads global manufacturing PMI by 18 months. Image: Nordea and Macrobond
The University of Michigan Consumer Confidence Sentiment Index Hit a 15-Year High Last time, it hit this level was in May 1997 and January 2004. That’s good news, because this level suggests that there is no imminent recession on the horizon.