The U.S. Dollar’s 15-Year Cycles

The U.S. Dollar’s 15-Year Cycles The chart suggests that the cycle in U.S. dollar from peak to peak is about 15 years on average. Image: Financial Times

Brent 5-Year Futures Price

Brent 5-Year Futures Price This chart shows that long-dated oil prices stayed relatively flat after attacks on Saudi Arabia’s oil infrastructure. Image: Goldman Sachs Global Investment Research

US Long-Term Mortgage Rates Decline: 30-Year Average 4.10% & 15-Year Average 3.57%

US Long-Term Mortgage Rates Decline: 30-Year Average 4.10% & 15-Year Average 3.57% Why US long-term mortgage rates decline? Mortgage costs are influenced by the 10-year Treasury yield which was lower this week, because the trade war between the United States and China pushes investors moving money from stocks to bonds. Bond yields fall as prices rise.…

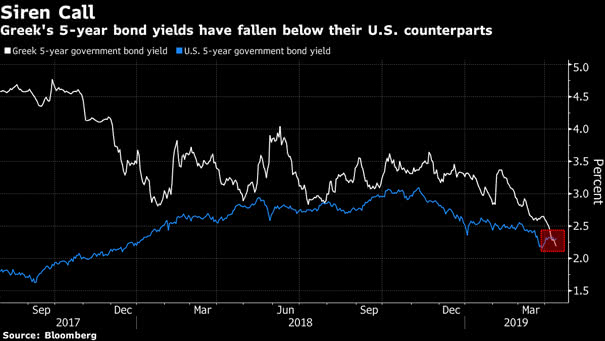
Greek’s 5-Year Bond Yields Have Fallen Below US 5-year Government Bond Yield

Greek’s 5-Year Bond Yields Have Fallen Below US 5-Year Government Bond Yield Which one would you choose? Greek bonds or US counterparts? This is a great example of financial market madness. Mark Twain once said, “History doesn’t repeat itself, but it does rhyme.” That’s true! Greece has spent around half its time in default on its…

45 Years of Asset Bubbles

45 Years of Asset Bubbles The parabolic move of Bitcoin in a short period of time has pushed it into bubble territory. Image: Deutsche Bank

S&P 500 Return Attribution Past 5 Years

S&P 500 Return Attribution Past 5 Years The performance of the S&P 500 is largely driven by stocks in the technology and e-commerce sectors. Image: BofA Research Investment Committee

In Fed We Trust

In Fed We Trust Confidence in Fed chair has reached a 15-year high. Image: Bloomberg