S&P 500 and Liquidity
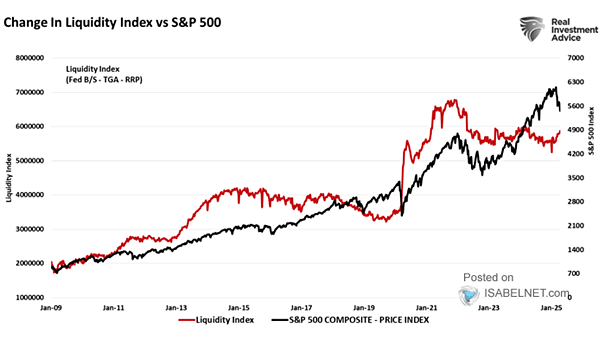
S&P 500 and Liquidity Increased aggregate U.S. liquidity generally acts as a tailwind for the stock market, potentially boosting equity prices—a dynamic currently reflected in the Liquidity Index. Image: Real Investment Advice
S&P 500 and Liquidity Increased aggregate U.S. liquidity generally acts as a tailwind for the stock market, potentially boosting equity prices—a dynamic currently reflected in the Liquidity Index. Image: Real Investment Advice
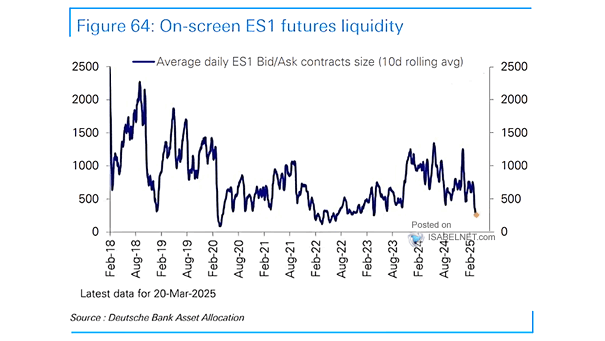
S&P 500 E-Mini Futures (ES1) Liquidity Thinning liquidity in financial markets exacerbates downside risks by increasing the likelihood of abrupt and severe price movements, particularly during economic or geopolitical shocks. Image: Deutsche Bank Asset Allocation

Global M2 Liquidity The increase in global M2 money supply suggests that liquidity is on the rise, which is likely to stimulate economic activity and push equity markets higher. Image: Morgan Stanley Research
S&P 500 – Change in Liquidity Will the support given to U.S. equities through the increase in net liquidity since March 2023 persist until the end of the year? Image: Morgan Stanley Research
Liquidity Policies and Central Bank Balance Sheets Central banks have barely decreased the amount of QE stock, suggesting a deliberate and measured strategy in scaling back economic support. Image: BofA Global Investment Strategy
S&P 500 vs. Liquidity A sharp drop in liquidity is seen as a potential headwind for U.S. equities. Image: TS Lombard
Valuation – S&P 500 PE vs. Liquidity Deteriorating liquidity may be a significant headwind for the S&P 500. Image: Longview Economics
S&P 500 vs. Overall Liquidity The tightening of liquidity remains a headwind for U.S. stocks. Image: Fidelity Investments
S&P 500 Total Return vs. USD Liquidity Proxy The U.S. liquidity outlook will be a headwind for U.S. stocks in the coming quarters. Image: Steno Research
S&P 500 Annual % Change vs. Liquidity Measure Shrinking excess liquidity remains a headwind for U.S. stocks. Image: Real Investment Advice
Liquidity – Market Depth of S&P 500 E-mini Futures U.S. equity market depth has been steadly improving. Image: J.P. Morgan