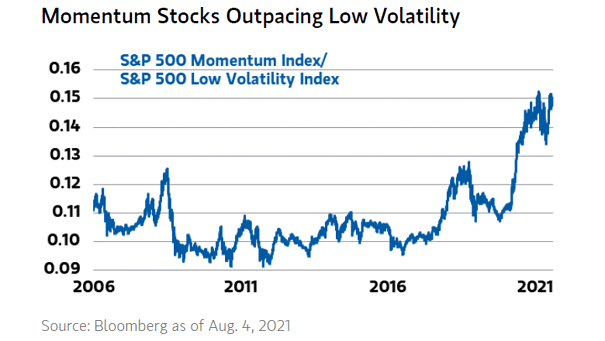
Value Stocks vs. Low Volatility Stocks

Value Stocks vs. Low Volatility Stocks Chart showing the large divergence between value stocks and low volatility stocks, like never before. Image: J.P. Morgan

S&P 500 Low Volatility Stocks Are the Best Performing Asset YTD

S&P 500 Low Volatility Stocks Are the Best Performing Asset YTD This chart shows that S&P 500 low volatility stocks are the best performing asset year-to-date (outside of GSCI energy). Actually, high-quality stocks are a good way to protect against a weak economy. Image: Goldman Sachs Global Investment Research

Average Daily Equity ETF Flow vs. S&P 500 Performance

Average Daily Equity ETF Flow vs. S&P 500 Performance Despite the S&P 500’s decline in Q1 2025, investors continued pouring money into equity ETFs, averaging nearly $3bn daily inflows—a sign of persistent appetite for U.S. equities amid volatility. Image: Strategas Research Partners

U.S. ETF and Mutual Fund Flows

U.S. ETF and Mutual Fund Flows Investors continue to show a strong appetite for U.S. money market funds as a safe and attractive option amid ongoing market volatility and high short-term interest rates. Image: Goldman Sachs Global Investment Research

Treasury Volatility – MOVE Index

Treasury Volatility – MOVE Index The decrease in U.S. rates volatility around a 3-year low, as indicated by the MOVE index, could be viewed as a positive development for both the bond market and the overall economy. Image: Deutsche Bank