S&P 500 – Duration of 5%+ Pullbacks
S&P 500 – Duration of 5%+ Pullbacks Typically, S&P 500 pullbacks of 5% or more tend to persist for an average of 28 days. Image: Deutsche Bank Asset Allocation
S&P 500 – Magnitude of 5%+ Pullbacks When pullbacks of 5% or more occur, historical data shows that the S&P 500 has experienced an average decline of -10.2% from its peak. Image: Deutsche Bank Asset Allocation
Pullbacks on the S&P 500 5%+ pullbacks are very common and can provide a good entry point to the U.S. stock market. Image: BofA US Equity & Quant Strategy
Pullbacks and Returns a Year Off the Lows for the S&P 500 Index Based on the 4-Year Presidential Cycle Historically, the S&P 500 average intra-year pullback from peak to trough has been more than 17% in midterm years. Image: LPL Research
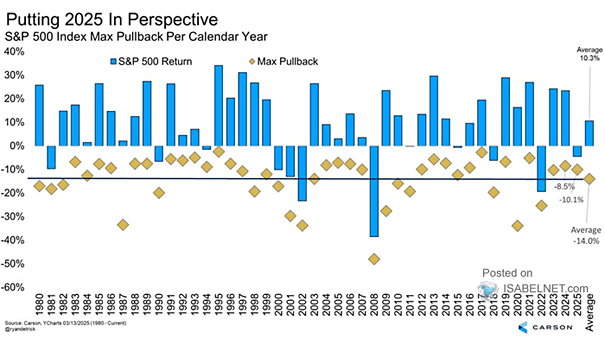
S&P 500 Index Max Pullback per Calendar Year Being prepared for market volatility is the key to wealth creation. Since 1980, the peak-to-trough pullback during the year has averaged 14% for the S&P 500 Index. Image: LPL Research
Returns – S&P 500 Index Pullbacks During a Midterm Year Pullbacks are normal during a midterm year. Historically, U.S. stocks are up more than 30% on average a year later. Image: LPL Research
S&P 500 Index Pullback Investors were all-in on the U.S. stock market this year. Is a major pullback on the horizon? Image: Bloomberg
S&P 500 and Pullbacks When should equity investors expect a major pullback? Image: Bloomberg
Days Since 5% Pullback From S&P 500 All-Time Highs The S&P 500 hasn’t seen as much as a 5% pullback since last October. Is a pullback approaching? Image: BofA Global Research
5% Pullbacks per Year for the S&P 500 Index Since 1950, the average number of 5% pullbacks per year in the S&P 500 Index is 3. Will pullbacks be short-lived this year? Image: LPL Research