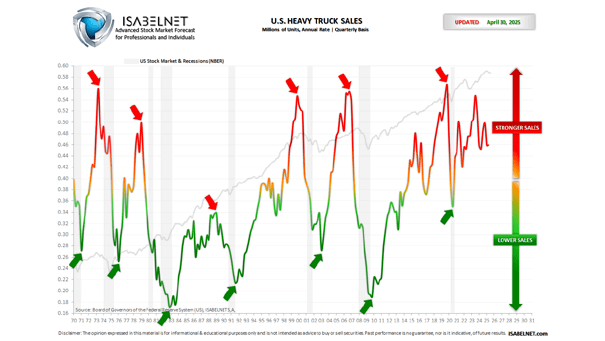
U.S. Real Retail Sales and Recession
U.S. Real Retail Sales and Recession In June, real retail sales stand at -0.68% YoY. About 70% of U.S. GDP is personal consumption. In the past, real retail sales trended sideways before the recession began.
S&P 500 Days Sales of Inventory The inventory de-stocking cycle hitting its trough often coincides with the beginning of a recovery in the broader business cycle, marked by rising demand, better economic conditions, and increased production and sales. Image: BofA Global Research
U.S. Heavy Trucks Sales and Recessions U.S. heavy trucks sales fell in May to 495K (annualized). Before recessions, heavy trucks sales tend to peak and then decline, providing insights into the overall health of the U.S. economy as a leading economic indicator. Click the Image to Enlarge
Recession – U.S. Real Retail Sales U.S. real retail sales have declined in 2024, suggesting ongoing weakness in consumer spending. Image: BofA Global Investment Strategy
1-Day Post-Reporting Performance vs. S&P 500 on EPS and Sales Surprise The bar was high for tech, energy and communication services. S&P 500 companies that reported weaker-than-expected earnings per share got punished much more than usual, reflecting the disappointment among investors. Image: BofA US Equity & Quant Strategy
G3 Real Core Retail Sales Since 2019, real core retail sales in the United States have risen significantly, while Germany has seen stagnant growth and Japan has witnessed a decline, reflecting differing economic conditions and consumer behaviors. Image: BofA Global Research
Markets – Cumulative S&P 500 Growth vs. Cumulative Real GDP Growth vs. Cumulative S&P Sales Growth Since 2007, U.S. stock prices rose 6 times more than U.S. real GDP. Is the disconnect between the stock market and the economy justified? Image: Real Investment Advice
U.S. Labor Market – U.S. Nonfarm Payrolls vs. Retail Sales Higher payrolls can potentially lead to higher retail sales, as increased income for employees can result in greater purchasing power. Image: BofA Global Investment Strategy
Valuation – S&P 500 Index Price-to-Sales Ratio U.S. equities remain expensive by historical standards, despite the correction. Image: Morgan Stanley Wealth Management
S&P 500 Profit Margin – Operating Earnings/Sales S&P 500 profit margins remain strong at 11.2%, despite many headwinds and higher labor costs. Image: J.P. Morgan Asset Management