Gold vs. 50/50 S&P 500 and U.S. Treasuries
Gold Price vs. S&P 500 Gold has recently surpassed $5,000 per ounce, but it still looks cheap next to a balanced 50/50 portfolio of U.S. stocks and Treasuries. Image: Bloomberg
Commodities vs. 50/50 S&P 500 and U.S. Treasuries Commodities remain undervalued relative to U.S. stocks and bonds, offering room for strategic allocations that enhance portfolio balance. Image: Bloomberg
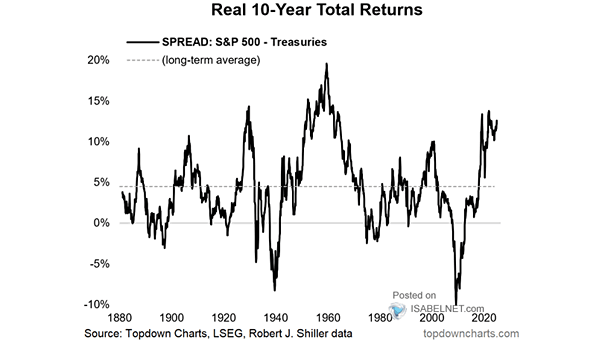
Real 10-Year Return – Spread: S&P 500 – Treasuries Over the past decade, investors have reaped substantial rewards from equities, as stocks have significantly outperformed bonds. However, the outlook for the next ten years indicates that this trend may not persist. Image: Topdown Charts
Annual Return of Treasuries – T-bills In 2024, U.S. Treasuries have once again underperformed cash, resulting in a challenging year for bond investors. Many investors have found more appealing opportunities in cash savings or other asset classes. Image: Bloomberg
Treasuries Flows BofA’s private clients are increasingly favoring U.S. Treasuries, particularly those with maturities between 2 to 10 years, as they anticipate a decline in yields in the near future. Image: BofA Global Investment Strategy
Valuation – S&P 500 vs. U.S. Treasuries The current high valuation of U.S. stocks compared to Treasuries suggests that investors are willing to pay more for stocks, possibly indicating optimism about future performance. Image: Topdown Charts
Performance – U.S. Core Capital Good Orders and DJIA vs. Treasuries Price Relative The performance of stocks relative to bonds is closely linked to the capital expenditure cycle. Image: BofA Global Investment Strategy
Seasonality – U.S. Equities vs. Treasuries Investors can profit from the seasonality of markets, as it is one factor that can impact asset prices. Image: True Insights
Return – U.S. ISM Manufacturing Index vs. U.S. Treasuries Could U.S. Treasuries represent a buying opportunity? Image: True Insights
Gold vs. Long-Term Treasuries Rising yields tend to be bearish for gold. Image: Morgan Stanley Wealth Management
S&P 500 Equity Risk Premium vs. U.S. Agg OAS Spread to Treasuries The S&P 500 equity risk premium remains too low relative to IG credit spreads. Image: Morgan Stanley Research