Treasuries Total Return Index
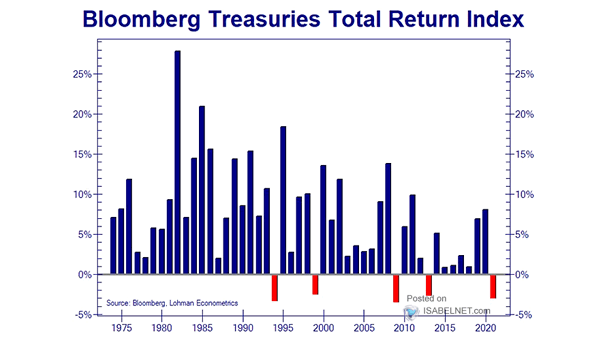
Treasuries Total Return Index Should investors expect total returns on U.S. Treasuries to be positive next year? Image: Lohman Econometrics
Treasuries Total Return Index Should investors expect total returns on U.S. Treasuries to be positive next year? Image: Lohman Econometrics
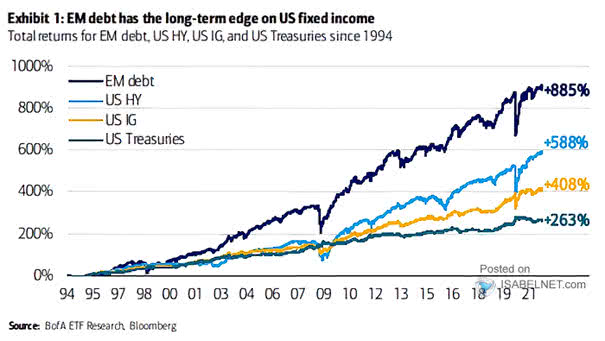
Total Returns for EM Debt, U.S. HY, U.S. IG and U.S. Treasuries Should EM debt be part of a long-term portfolio? Image: BofA ETF Research

MSCI World Value Index/MSCI World Growth Index vs. Global Agg. Treasuries Index, Yield to Worst Value should outperform Growth and follow the rise in global rates. Image: Morgan Stanley Wealth Management
Bond Market – Rally in U.S. Treasuries Is the recent rally in U.S. Treasuries over? Image: Deutsche Bank Research
Yields and Breakeven Inflation on 10-Year U.S. Treasuries Breakeven inflation seems to have peaked. Image: Gavekal, Macrobond
7-10 Treasuries Total Return Index / Gold in U.S. Dollar Gold tends to beat U.S. Treasuries on inflationary fears. Image: Gavekal, Macrobond
U.S. Treasuries Seasonality Historically, U.S. 10-year yields tend to drop on average from May to November. Image: Nordea and Macrobond
Performance – S&P 500’s Outperformance Over U.S. Treasuries Will the S&P 500’s outperformance over U.S. Treasuries continue? Image: Arbor Research & Trading LLC
Largest Drawdowns in U.S. Treasuries Will U.S. Treasuries continue to suffer? Image: BofA Research Investment Committee
U.S. Yield Curve – Spread Between the 10-Year and 2-Year Treasuries A steepening yield curve suggests a stronger economic growth and rising inflation. Image: CNBC
U.S. Treasuries Held by Foreign Official Accounts vs. U.S. Dollar Index A bearish move in the U.S. dollar tends to increase foreign official holdings of U.S. Treasuries. Image: BofA