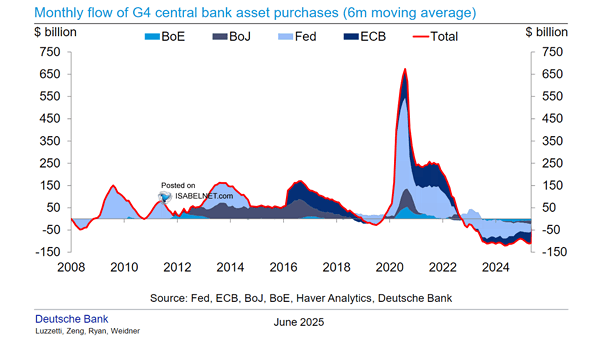
G5 Central Banks Balance Sheet vs. Nominal GDP Growth
G5 Central Banks Balance Sheet vs. Nominal GDP Growth Shrinking global excess liquidity tends to be a headwind for equity markets. Image: J.P. Morgan
G4 Central Bank Balance Sheet Will central bank’s quantitative tightening increase pressure on financial markets? Image: BofA Global Investment Strategy
Interest Rates – Central Bank Policy Rate Hikes Minus Cuts Central banks around the world have been slowing the pace of their interest rate hikes in recent months. Image: BofA Global Investment Strategy
Major Central Bank Policy Rates The peak in interest rates among major central banks is yet to come. Image: Wells Fargo Economics
Central Bank – BOJ Outright Purchases of JGBs Will the Bank of Japan (BOJ) continue to buy Japanese government bonds as part of its yield curve control policy? Image: BofA Global Investment Strategy
Equities – FANG+ Index vs. Major 5 Central Banks Index The contraction of central bank balance sheets tends to push tech giants lower. Image: Deutsche Bank
Central Bank Balance Sheets as a Share of GDP Will the reduction of central bank balance sheets increase pressure on financial markets in 2023? Image: J.P. Morgan
Number of Global Central Bank Hikes and Cuts Will the global hiking cycle come to an end in 2023? Image: Deutsche Bank
Percent of Central Banks Tightening vs. Global Manufacturing PMI Global policy tightening is putting downward pressure on global growth. Image: BofA Global Research
Central Banks – Global Monetary Policy Stimulus Leads Global Manufacturing PMI Global monetary policy stimulus tends to lead global manufacturing PMI by 8 months. Is a hard landing inevitable? Image: Topdown Charts