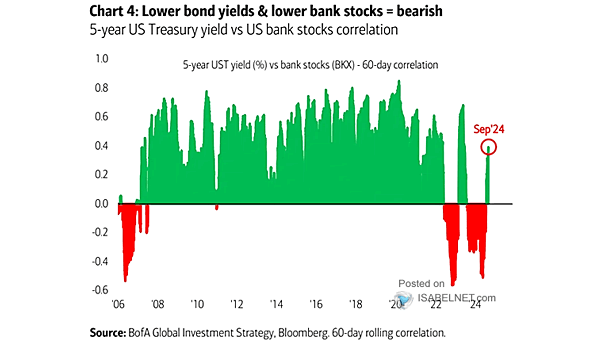
Nasdaq 100 vs. 5-Year U.S. TIPS Yield (Inverted)
Nasdaq 100 vs. 5-Year U.S. TIPS Yield (Inverted) Growth stocks suffered from rising real yields. Image: The Daily Shot
Recession – U.S. 5-Year Treasury Yield and Banks vs. S&P 500 High inflation will lead likely to a recession in the United States. Image: BofA Global Investment Strategy
Performance – Banks vs. S&P 500 and U.S. 5-Year Treasury Yield BofA expects the S&P 500 to drop below 4,000 this year. Image: BofA Global Investment Strategy
Gold Price vs. U.S. 5-Year TIPS Yield Generally, when the U.S. 5-year TIPS yield goes up, gold tends to go down. Image: The Daily Shot
Rates – Short Duration vs. Long Duration Indexed Relative to Basket Return and 5-Year, 5-Year Forward Real U.S. Treasury Yield Short vs. long duration tends to track the path of U.S. rates. Image: Goldman Sachs Global Investment Research
S&P 500 and Euro Stoxx 50 – 5-Year Implied Dividend Yield S&P 500 and Euro Stoxx 50 implied dividend yields remain very low. Image: Goldman Sachs Global Investment Research
Yield Curve – Difference 5-Year and 30-Year Treasury Yields The yield curve steepens after the Fed pivot. Are Gold prices at risk? Image: Financial Times
Relative Performance of Bank Shares vs. Index and 5-Year Treasury Yield This chart suggests the relationship between interest rates and relative bank performance. Image: BofA Global Investment Strategy
5-Year TIPS Yield (U.S. Real Rates) vs. Gold Generally, when the U.S. 5-year TIPS yield goes down, gold tends to up. Image: The Daily Shot
Chinese 5-Year Benchmark Yield Leads Global Manufacturing PMI Great chart suggesting that the Chinese 5-year benchmark yield leads global manufacturing PMI by 18 months. Image: Nordea and Macrobond