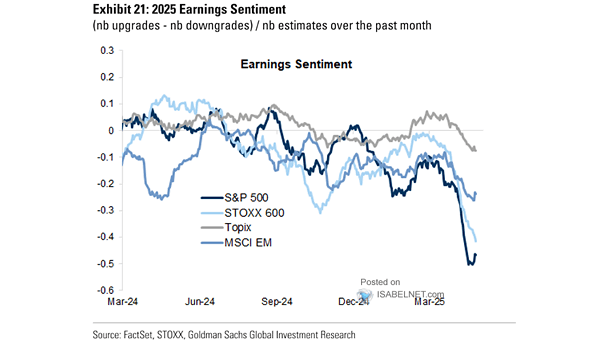
Proportion of S&P 500 Beating Earnings Estimate

Proportion of S&P 500 Beating Earnings Estimate Many S&P 500 companies reported earnings that exceeded expectations during Q3, which is a positive sign as it demonstrates their ability to navigate uncertainties and generate sustainable growth. Image: Deutsche Bank Asset Allocation

S&P 500 Earnings Estimates

S&P 500 Earnings Estimates Morgan Stanley predicts that S&P 500 EPS will rise to $229 in 2024 and $266 in 2025. This forecast indicates the potential for future expansion and profitability. Image: Morgan Stanley Wealth Management

Valuation – S&P 500 Price/Earnings Ratio

Valuation – S&P 500 Price/Earnings Ratio The S&P 500 P/E multiple remains above the average level observed since 1990, indicating investors’ willingness to pay more for earnings, possibly due to optimism about future growth. Image: Goldman Sachs Global Investment Research

S&P 500 Earnings Revisions Breadth

S&P 500 Earnings Revisions Breadth Earnings revisions breadth for both large and small caps has returned to negative territory, which means that the overall sentiment and expectations for future earnings have worsened. Image: Morgan Stanley Research

Deviation of Earnings Above/Below Long Term Growth Trend

Deviation of Earnings Above/Below Long Term Growth Trend The current earnings estimates deviate significantly from the long-term growth trend, causing unease among bullish investors concerned about the sustainability and justification of these elevated projections. Image: Real Investment Advice

S&P 500 Earnings Revisions Breadth

S&P 500 Earnings Revisions Breadth Earnings revisions breadth has experienced a significant decline, which could be a worrisome indicator of potential challenges in the overall earnings outlook for S&P 500 companies. Image: Morgan Stanley Research

S&P 500 Earnings Revisions Breadth vs. S&P 500 YoY

S&P 500 Earnings Revisions Breadth vs. S&P 500 YoY The decline in earnings revisions breadth and its deviation from the S&P 500 performance suggests a disparity between analyst expectations for corporate earnings and the actual trajectory of the S&P 500. Image: Morgan Stanley Research

S&P 500 TTM EPS Before/After Earnings Troughs

S&P 500 TTM EPS Before/After Earnings Troughs After a period of decline, S&P 500 earnings tend to rebound and grow at a faster rate than the decline they experienced. This pattern may not apply to every individual company in the index. Image: BofA US Equity & Quant Strategy