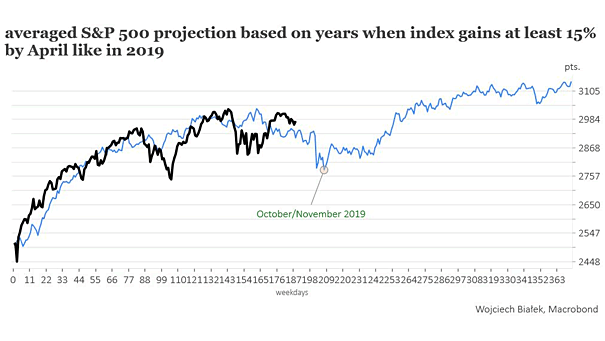
S&P 500 Levels, Bank Projections

S&P 500 Levels, Bank Projections Morgan Stanley is a bear, but Wall Street expects gains for the S&P 500 in 2020 Image: Financial Times

S&P 500 Annualized 10-Year Total Return Forecasts

S&P 500 Annualized 10-Year Total Return Forecasts Goldman Sachs forecasts a 3% average annualized total return for the S&P 500 over the next decade. This projection is notably lower than historical averages, driven by worries about elevated equity valuations. Image: Goldman Sachs Global Investment Research

S&P 500 Forward Earnings Estimates

S&P 500 Forward Earnings Estimates Wall Street’s optimistic earnings projections have sparked debate about their alignment with economic realities. While many analysts remain bullish, there are growing concerns about the sustainability of these projections. Image: Real Investment Advice

S&P 500 – Consensus Year-End Target

S&P 500 – Consensus Year-End Target Wall Street strategists are reevaluating their bullish projections for the S&P 500 as the index struggles in early 2025. Despite an average year-end forecast of 6,511.36, the benchmark is down 1.89% year-to-date. Image: Bloomberg

S&P 500 EPS and Long-Term Trend in Earnings

S&P 500 EPS and Long-Term Trend in Earnings The S&P 500’s earnings trend remains robust, with projections indicating continued growth near the upper limits of its long-term trend channel. Image: Deutsche Bank

S&P 500 Historical Earnings-per-Share (EPS)

S&P 500 Historical Earnings-per-Share (EPS) The consensus projection suggests that the S&P 500 will achieve 18% EPS growth by the end of 2025, reflecting confidence in corporate profitability as we move into 2025. Image: BofA Global Investment Strategy

U.S. ISM Manufacturing PMI vs. S&P 500 EPS Growth

U.S. ISM Manufacturing PMI vs. S&P 500 EPS Growth A rise in the U.S. ISM manufacturing PMI is suggesting positive growth in 1Q EPS, with expectations of outperforming the initial projections. Image: BofA US Equity & Quant Strategy

S&P 500 and Pattern Breakouts

S&P 500 and Pattern Breakouts The chart projection on the S&P 500 suggests 4300, given the summer’s breakout from a bullish cup-and-handle. Image: BofA Global Research