M2 Money Supply
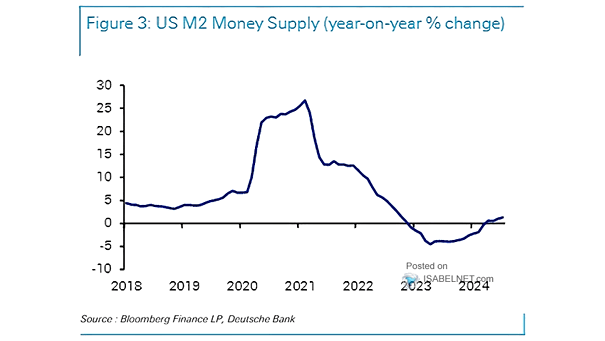
M2 Money Supply The recent rise in the M2 money supply in the United States is considered a favorable development for equity markets, enhancing liquidity and potentially driving additional investment in stocks. Image: Deutsche Bank
M2 Money Supply The recent rise in the M2 money supply in the United States is considered a favorable development for equity markets, enhancing liquidity and potentially driving additional investment in stocks. Image: Deutsche Bank
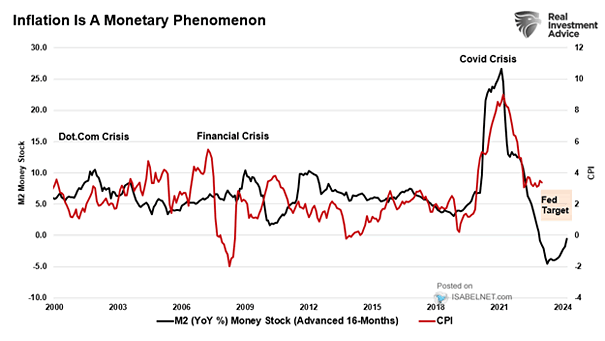
M2 Money Supply and CPI Inflation The significant decline in money supply growth is one of the factors contributing to the contraction of inflation in the United States. Image: Real Investment Advice

S&P 500 to M2 Ratio The rising S&P 500 to M2 ratio suggests a potential overvaluation in the U.S. stock market. This trend implies greater demand for stocks compared to the supply of money, worrying investors and analysts. Image: Topdown Charts
U.S. M2 to Nominal GDP Ratio The return of the U.S. M2 to nominal GDP ratio to its long-term trend is a positive indicator. It reflects a healthier balance between money supply and economic output, fostering stability and sustainable growth in the economy. Image: Federal Reserve Bank of St. Louis
M2 Annual % ROC (Advanced 12-Months) vs. GAAP Earnings (Leading Indicator) The significant decline in M2 growth puts GAAP earnings at risk. Image: Real Investment Advice
M2 Growth vs. U.S. Nominal GDP The sharp contraction in M2 growth could be a cause for concern when it comes to U.S. nominal GDP growth. Image: Deutsche Bank
EPS – Real M2 Growth vs. S&P 500 12-Month Forward Earnings-Per-Share Estimate The decline in real M2 growth does not bode well for S&P 500 earnings. Image: Morgan Stanley Wealth Management
Inflation – CPI vs. M2 M2 growth tends to lead CPI by 16 months, suggesting lower U.S. inflation ahead. Image: Morgan Stanley Research
S&P 500 Index vs. M2 Money Supply Global M2 money supply growth has a significant impact on U.S. stocks. Image: Morgan Stanley Wealth Management
Global M2 and S&P 500 Index The decrease in global liquidity is potentially bad news for U.S. equity returns. Image: Morgan Stanley Research