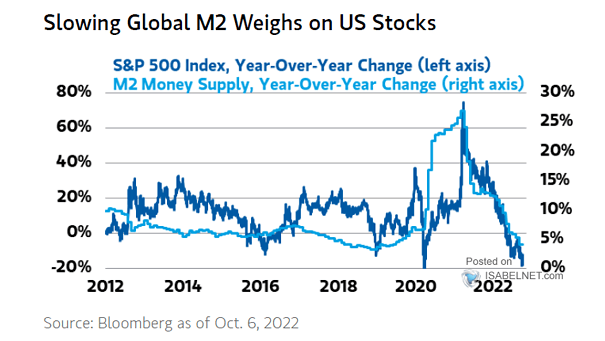
S&P 500 Index vs. M2 Money Supply
S&P 500 Index vs. M2 Money Supply Global M2 money supply growth has a significant impact on U.S. stocks. Image: Morgan Stanley Wealth Management
S&P 500 Index vs. M2 Money Supply Global M2 money supply growth has a significant impact on U.S. stocks. Image: Morgan Stanley Wealth Management
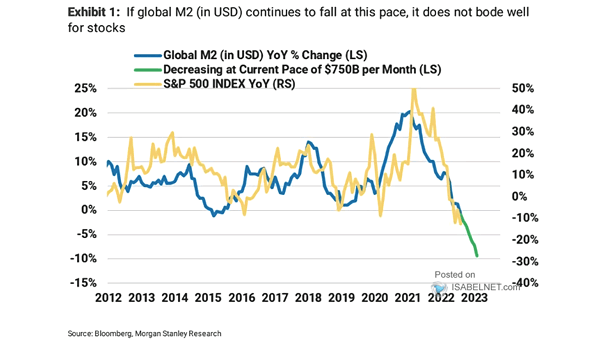
Global M2 and S&P 500 Index The decrease in global liquidity is potentially bad news for U.S. equity returns. Image: Morgan Stanley Research

Bitcoin Market Capitalization and Global M2 Money Supply Bitcoin could fall if global M2 money supply continues to slow. Image: Morgan Stanley Research
M2 – Money Supply vs. Monetary Velocity Is printing more money good for the U.S. economy? Despite strong M2 growth, money velocity has declined. Image: Real Investment Advice
Valuation – MSCI U.S. Market Capitalization / U.S. M2 Money Supply Should investors take a cautious approach to the U.S. stock market? Image: Gavekal, Macrobond
Economic Growth vs. M2 Velocity The decline in economic growth has coincided with a collapse in M2 velocity Image: Real Investment Advice
M2 / Equity Market Capitalization vs. S&P 500 Could a liquidity shortage send the S&P 500 lower? Image: Alpine Macro
Performance – S&P 500 and U.S. M2 Money Supply Minus Nominal GDP Growth (Leading Indicator) Should investors expect the S&P 500 to perform poorly over the next 12 months? Image: Alpine Macro
U.S. Excess Liquidity (M2 Minus Nominal GDP) and S&P 500 P/E Ratio (Leading Indicator) U.S. excess liquidity (M2 minus nominal GDP) tends to lead the S&P 500 P/E ratio by 6 months. Image: Nordea and Macrobond
S&P 500 and U.S. M2 Minus Bank Credit (Leading Indicator) U.S. M2 minus bank credit tends to lead the S&P 500 by 6 months. Image: Alpine Macro
Velocity of M2 Money Stock in the U.S. vs. The U.S. Deficit The rise in the U.S. deficit has coincided with a collapse in M2 velocity. Image: Real Investment Advice