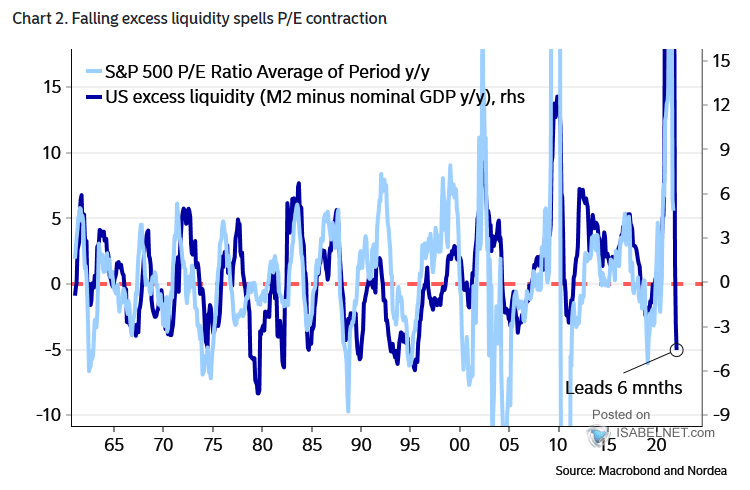
Oct 01 2021 Off U.S. Excess Liquidity (M2 Minus Nominal GDP) and S&P 500 P/E Ratio (Leading Indicator) U.S. excess liquidity (M2 minus nominal GDP) tends to lead the S&P 500 P/E ratio by 6 months.Image: Nordea and Macrobond