Share of Passive vs. Active Equity Funds
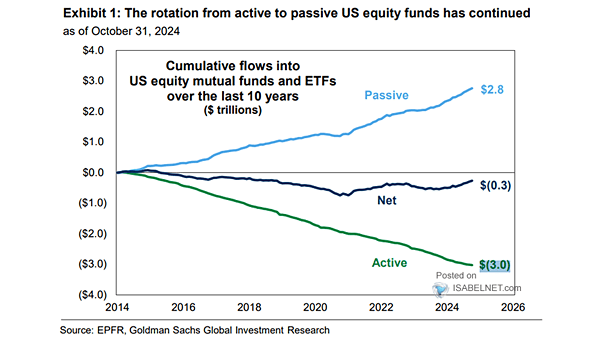
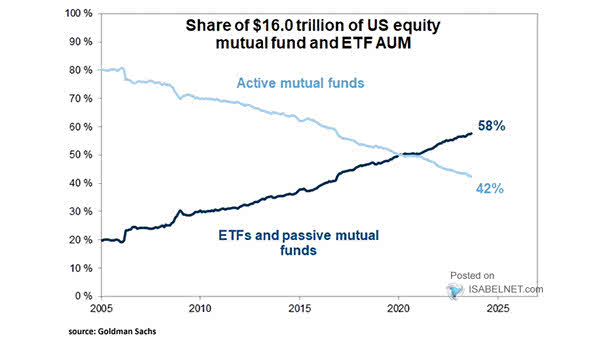
Share of U.S. Equity Mutual Fund and ETF AUM Passive U.S. equity funds surpassed active ones in 2020. Investors prefer them due to their lower fees, potential tax benefits, and the belief that active fund managers cannot consistently outperform the market. Image: Goldman Sachs Global Investment Research