Consensus EPS Growth Estimates
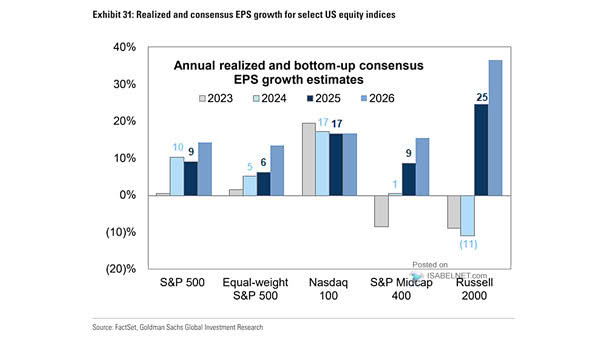
Consensus EPS Growth Estimates Consensus forecasts suggest a resilient corporate sector, with S&P 500 EPS expected to grow by 7% in 2025 and accelerate to 14% in 2026, reflecting optimism despite economic uncertainties. Image: Goldman Sachs Global Investment Research