China – Total CO2 Emissions by Region
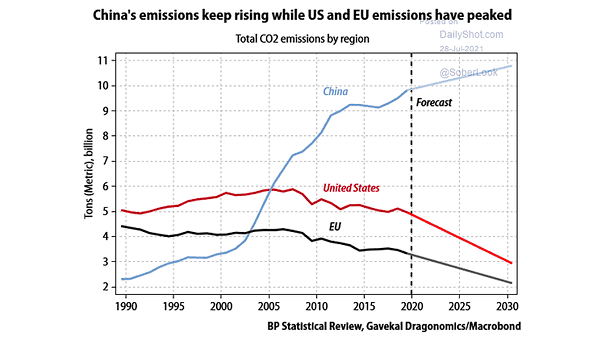
China – Total CO2 Emissions by Region China’s CO2 emissions continue to rise. Will China be carbon neutral by 2060? Image: Gavekal, Macrobond
China – Total CO2 Emissions by Region China’s CO2 emissions continue to rise. Will China be carbon neutral by 2060? Image: Gavekal, Macrobond
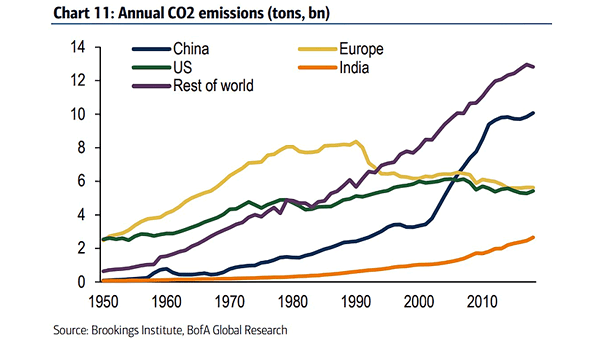
Annual CO2 Emissions The U.S. and Europe account for under one-third of CO2 emissions. Image: BofA Global Research

Impact of Global Warming on World GDP (CO2 Emission) This chart suggests the impact of global warming on world GDP. Image: Oxford Economics
Share of Global Annual CO2 Emissions To achieve the global warming target in the Paris Agreement, net zero emissions should be reached by 2050. Image: Financial Times
Annual Average Temperature Anomaly and CO2 Concentration Chart showing the correlation between CO2 concentration and annual average temperature anomaly. Image: Morgan Stanley Research
Climate – CO2 Concentration and Temperature over 800,000 Years This interesting chart shows the correlation between CO2 concentration and temperature over 800,000 years. Image: J.P. Morgan
Global CO2 Emissions Worried about climate change? Global carbon dioxide emissions hit a record this year. Image: Financial Times
Global Air Travel – CO2 Emission In 2018, annual global passenger numbers rose 7% to 4.4 billion and could double by 2037. Image: Financial Times
Carbon Dioxide Emissions (CO2) and GDP Per Capita Interesting chart showing carbon dioxide emissions and GDP per capita for some countries. Did you expect that? Image: Macrobond
Total Carbon Emissions by Country (CO2) China, the United States, and India account for almost half of the total global carbon emissions. Image: Global Carbon Project
Annual Carbon Emissions in Tons (CO2) About 86% of global carbon emissions are produced by countries other than the United States. You may also like “Total Global Carbon Emissions.” Image: Bloomberg