COMEX Copper Price
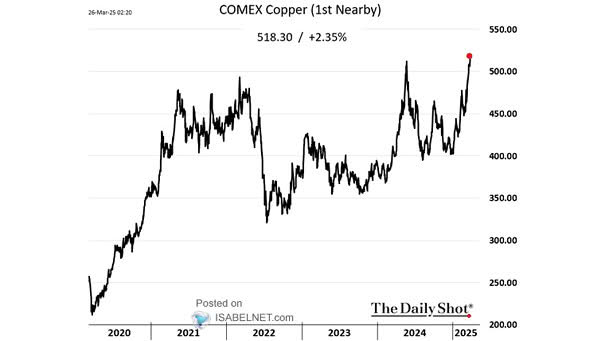
COMEX Copper Price The Trump administration may impose 25% copper import tariffs within weeks, sparking market volatility as traders rush shipments to the U.S., driving copper prices to record highs. Image: The Daily Shot
COMEX Copper Price The Trump administration may impose 25% copper import tariffs within weeks, sparking market volatility as traders rush shipments to the U.S., driving copper prices to record highs. Image: The Daily Shot
Copper to Gold Ratio and U.S. 10-Year Treasury Yield (Leading Indicator) The copper/gold ratio and the 10-year U.S. Treasury yield are showing signs of a persistent divergence. Image: Morgan Stanley Research

Commodities (Oil, Gold, Copper) – Commodity Net Long Positioning While there are some pressures from rising U.S. Treasury yields and a stronger U.S. dollar, the current landscape for gold positioning is marked by a robust bullish sentiment, with increasing net long positions. Image: Goldman Sachs Global Investment Research
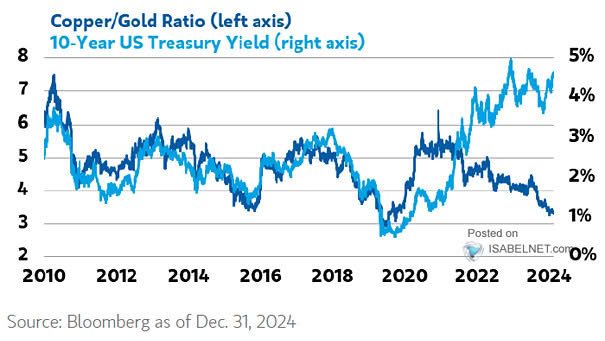
Copper to Gold Ratio and U.S. 10-Year Treasury Yield The copper-to-gold ratio is often considered a leading indicator for the direction of the 10-year U.S. Treasury yield under certain market conditions. Image: The Daily Shot
CTAs Exposure to Copper CTAs have a bullish outlook on copper due to the anticipated surge in demand driven by infrastructure development and the global shift towards renewable energy sources. Image: Deutsche Bank Asset Allocation
Gold-to-Copper Price Ratio The gold-to-copper price ratio is currently far from a level of complacency. Image: J.P. Morgan
Copper/Gold Ratio vs. U.S. 10-Year Yield The copper to gold ratio tends to lead the 10-year U.S. Treasury yield. Image: Strategas Research Partners
Inflation – ISM Services Business Prices vs. Copper The rise of copper prices is a cause for concern as it can lead to higher prices for a variety of goods and services. Image: Steno Research
Copper Price vs. China Aggregate Financing Copper prices are expected to rise over the next 10 months, thanks to China’s reopening. Image: Alpine Macro
Copper to Gold Ratio and 10-Year U.S. Treasury Yield Does the copper to gold ratio suggest stagflation is around the corner? Image: Morgan Stanley Research
EUR/USD and Copper The gap between EUR/USD and copper is widening. Will the price of copper fall? Image: BCA Research