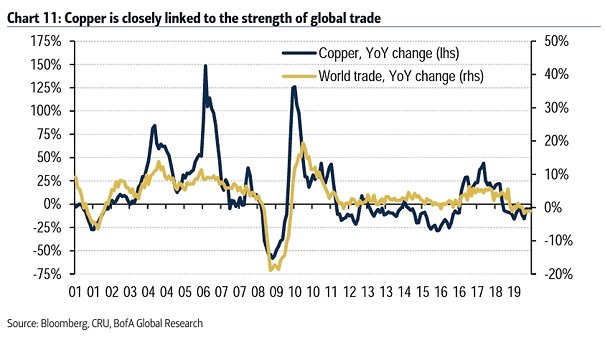
World Trade and Copper
World Trade and Copper Chart suggesting that any improvement in world trade should benefit copper. Image: BofA Global Research
World Trade and Copper Chart suggesting that any improvement in world trade should benefit copper. Image: BofA Global Research
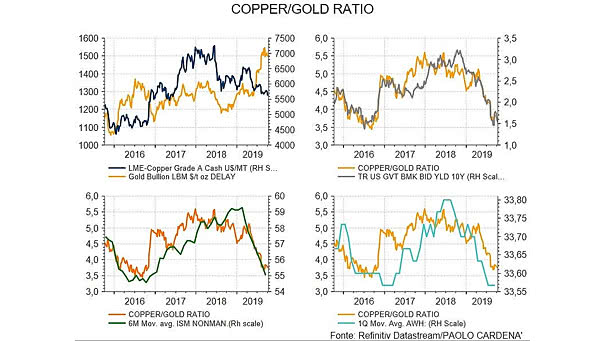
Copper to Gold Ratio The copper to gold ratio provides useful information on the evolution of the U.S. 10-year Treasury, the ISM Non-Manufacturing Index and the average weekly hours worked. Image: Paolo Cardena

Copper vs. China and Gold vs. U.S. Real Yields Copper price is underperfoming gold, because China 10-year yields and U.S. real yields are falling. Image: Topdown Charts
Copper to Gold Ratio and Conference Board Leading Economic Index (LEI) When the copper-to-gold ratio decreases, it is an early warning signal for the economy, meaning that growth optimism is fading. Image: Wells Fargo Investment Institute
Copper to Gold Ratio and U.S. 10-Year Treasury Yield The chart suggests that the correlation between the copper/gold ratio and the US 10-year Treasury yield is still valid. Image: Nordea and Macrobond
U.S. 10-Year Yields vs. Copper To Gold Ratio Great chart showing a strong correlation between U.S. 10-year yields and the copper to gold ratio. Image: Nordea and Macrobond
Probability of U.S. Recession As Priced Across Asset Classes The S&P 500 is pricing in about a 25% chance of a recession, which is lower than signals from copper prices or the yield curve, but higher than the recession probabilities implied by global equities or high-yield credit markets. Analysts often use the current percentage change…
Rotation vs. U.S. GDP Growth Forecasts Chart suggesting that the rotation out of bonds into equities, out of growth into cyclicals, out of large caps into small caps, and out of gold into copper, is expected to continue in 2020. Image: Fidelity Investments