Leverage – Net Debt to EBITDA of Small Caps vs. Large Caps
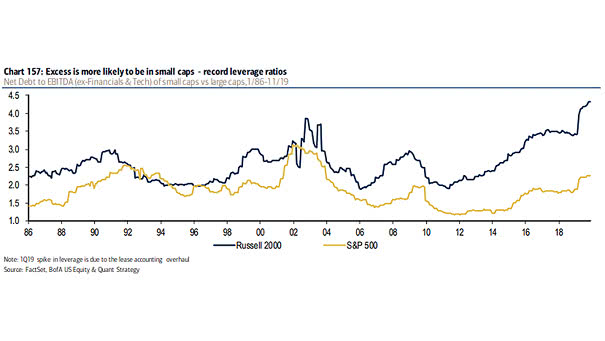
Leverage – Net Debt to EBITDA of Small Caps vs. Large Caps Excess leverage is more pronounced among U.S. small caps. Image: BofA US Equity & Quant Strategy
Leverage – Net Debt to EBITDA of Small Caps vs. Large Caps Excess leverage is more pronounced among U.S. small caps. Image: BofA US Equity & Quant Strategy
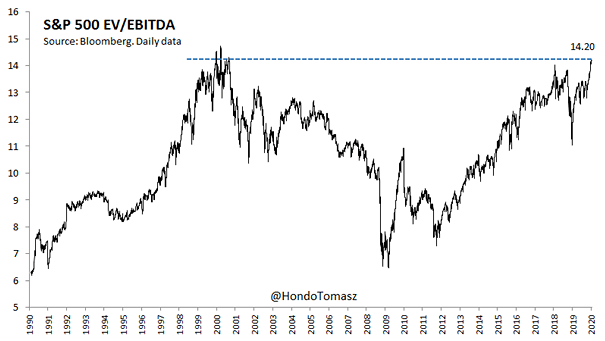
Valuation – S&P 500 EV/EBITDA The EV/EBITDA of the S&P 500 suggests that stocks are as expensive as they were during the Internet bubble. Image: Tomasz Hońdo

Russell 2000 Trailing EV/EBITDA Multiples vs. Private Equity EBITDA Multiples This chart shows that private equity multiples are currently higher than public equity multiples. Image: Strategas
Small-Caps: Upper End of Long-Term Range The combination of historical patterns, attractive valuations, and positive earnings growth forecasts suggests that U.S. small-caps may be well-positioned for a period of outperformance in the near future. Image: Fundstrat Global Advisors, LLC
U.S. Corporate Leverage U.S. corporate leverage is high and close to its previous peak on a net debt to EBITDA. Image: Goldman Sachs Global Investment Research
Corporate Leverage in the U.S. U.S. corporate debt is high. This chart shows that U.S. corporate leverage is close to its previous peak on a net debt to EBITDA. You may also like “U.S. Leveraged Loan Index Rating Breakdown: 2008 vs. 2019.” Image: Credit Suisse Research