Probability of S&P 500 Drawdown / Rally
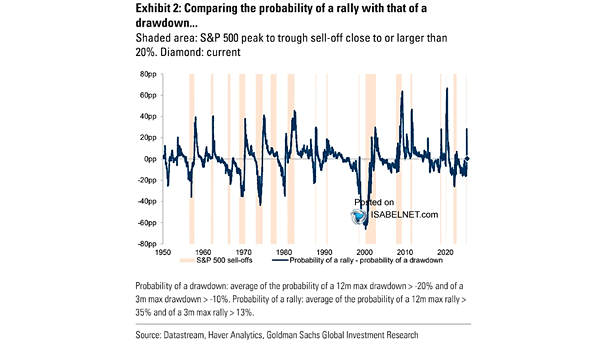
Probability of S&P 500 Drawdown / Rally The S&P 500 has reached a point where the probabilities of a sharp rally and a meaningful drawdown are closely aligned, signaling a market at equilibrium. Image: Goldman Sachs Global Investment Research