NAAIM Exposure Index – Investor Sentiment​

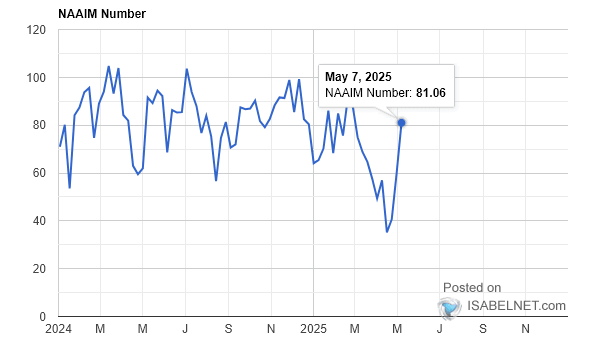
NAAIM Exposure Index – Investor Sentiment The National Association of Active Investment Managers Exposure Index represents the two-week moving average exposure to U.S. equity markets reported by NAAIM members. The NAAIM Exposure Index stands at 54.33, active investment managers are less optimistic. Image: National Association of Active Investment Managers (NAAIM)

CTAs Exposure to Equities

CTAs Exposure to Equities CTAs overall allocation to equities was in the 52th percentile last week. Image: Deutsche Bank Asset Allocation

Hedge Fund and Mutual Fund Equity Exposure

Hedge Fund and Mutual Fund Equity Exposure Hedge funds and mutual funds have raised their equity exposure year-to-date. Image: Goldman Sachs Global Investment Research

CTAs Exposure to Bonds

CTAs Exposure to Bonds CTAs overall allocation to bonds was in the 15th percentile last week. Image: Deutsche Bank Asset Allocation

CTAs Exposure to Gold

CTAs Exposure to Gold CTAs are still long gold. Image: Deutsche Bank Asset Allocation

Financials and Banking Exposure by Index

Financials and Banking Exposure by Index The Russell 2000 has more exposure to financial stocks (18.5%) than the S&P 500 (10.5%). Image: J.P. Morgan Asset Management