Beta Exposure of Large Cap U.S. Active Managers vs. S&P 500
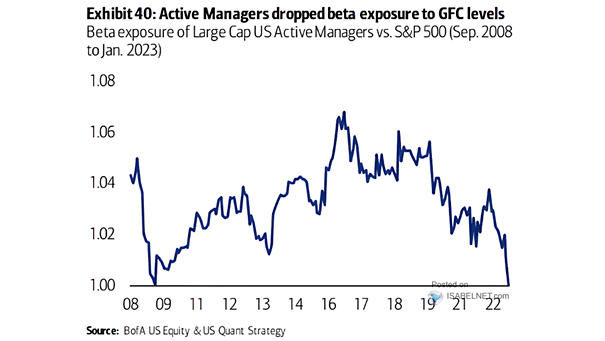
Beta Exposure of Large Cap U.S. Active Managers vs. S&P 500 Among active managers, there is a significant drop in beta exposure to GFC levels. Image: BofA US Equity & Quant Strategy
Beta Exposure of Large Cap U.S. Active Managers vs. S&P 500 Among active managers, there is a significant drop in beta exposure to GFC levels. Image: BofA US Equity & Quant Strategy
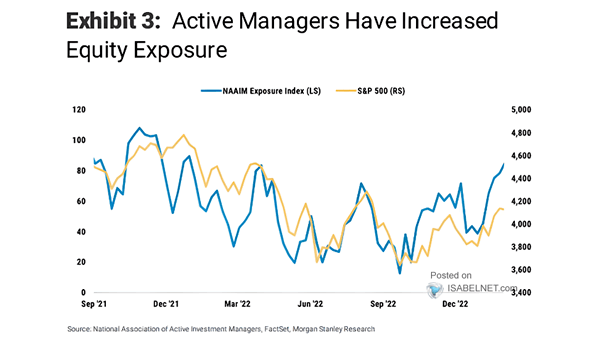
Sentiment – S&P 500 vs. NAAIM Exposure Index Active investment managers are chasing price. Are they too optimistic? Image: Morgan Stanley Research

U.S. Dollar Index (DXY) and Internation vs. Domestic Sales Exposure Will the U.S. dollar fall next year, as the United States enters recession? Image: Alpine Macro
Value vs. Growth – Active Managers’ Relative Exposure in Low P/FCF vs. High Long-Term Growth Despite the rally in Value, active managers are still ~30% underweight Value vs. Growth. Image: BofA US Equity & Quant Strategy
Global Macro Hedge Funds’ Net Exposure to U.S. 10-Year Treasury Bond In terms of positioning, global macro hedge funds are currently long U.S. Treasuries. Image: Nomura
NAAIM Exposure Index and S&P 500 Index Asset Manager/Institutional Short Futures Only Open Interest Is the U.S. stock market ripe for a correction? Image: BCA Research
CTAs Exposure to Equities CTAs overall equity exposure is in the 42th percentile. Image: Deutsche Bank Asset Allocation
Hedge Funds’ Aggregate Net Exposure to DM Equities The overall hedge funds net exposure to DM stock market is not stretched. Image: Nomura
MSCI World Index with China Exposure vs. MSCI World Index Investors have noticed that China emerged from recession months ago. Image: Morgan Stanley Research
Factor Exposure of Hedge Fund Long U.S. Equity Portfolio Growth stocks remain among the most popular choices for hedge funds. Image: Goldman Sachs Global Investment Research
NAAIM – Equity Exposure of U.S. Active Managers U.S. active managers are optimistic, as they have the highest level of exposure to equities in over two years, betting on a rebound in global growth. Image: Morgan Stanley Research