S&P 500 Total Return vs. “Sell in May”
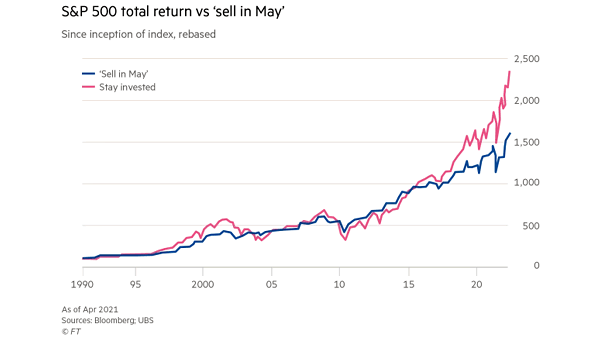
S&P 500 Total Return vs. “Sell in May” Is “Sell in May and Go Away” a myth? Image: Financial Times
S&P 500 Total Return vs. “Sell in May” Is “Sell in May and Go Away” a myth? Image: Financial Times
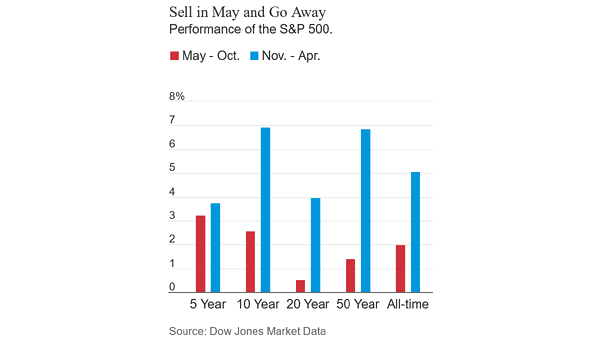
Sell in May and Go Away – Performance of the S&P 500 The next 6 months have been the worst on average, but the S&P 500 has been higher 7 of the past 8 years during the May to October period. Image: Barron’s

Sell in May and Go Away Is a Myth The S&P 500 Total Return from 1928 to 2018 shows that “Sell in May and Go Away” was not a winning strategy. Image: Charlie Bilello
Sell in May and Go Away? Just keep in mind that 2013, 2014, 2015, 2016, 2017 and 2018 were positive in May. Image: Hedgeye Risk Management LLC
Sell in May and Go Away? Maybe Not this Year Because the third-year of a president’s term is positive (91% of the time since 1925) and in six of the past seven years the US stock market has performed very well. Image: MarketWatch
% of Large Cap Active Funds Outperforming Russell 1000 Benchmarks in May Best May in history for actively managed large-cap funds. But can active large-cap funds outperform benchmark over a full market cycle? Image: BofA US Equity & Quant Strategy
S&P 500 Index Return During May The “sell in May and go away” adage is more myth than practical advice. Rather than trying to time the market, focusing on long-term goals is wiser-especially since May has delivered positive returns in 9 of the past 10 years. Image: Carson Investment Research
Company Insider Buy-Sell Ratio As the S&P 500 continues its rally, corporate insider selling alone may not definitively predict a market downturn, but it can be a signal of executive caution or opportunistic profit-taking. Image: Bloomberg
S&P 500 Fwd. Earnings Growth and Russell 2000 Fwd. Earnings Growth The recovery in EPS growth has been driven by a small number of large-cap companies, which may indicate a late-cycle extension in the economic cycle. Image: Morgan Stanley Research
Sell Side Consensus Indicator The Sell Side Indicator, which tracks Wall Street strategists’ equity allocation recommendations, has remained unchanged in September. The current level suggests that the S&P 500 may see positive gains over the next 12 months. Image: BofA US Equity and Quant Strategy
Valuation – Relative Forward P/E: Russell 2000 vs. Russell 1000 Small-caps may be an attractive option for long-term investors looking to diversify their investment portfolios, as they offer relatively cheaper valuations compared to large-caps. Image: BofA US Equity & Quant Strategy