Treasury QT
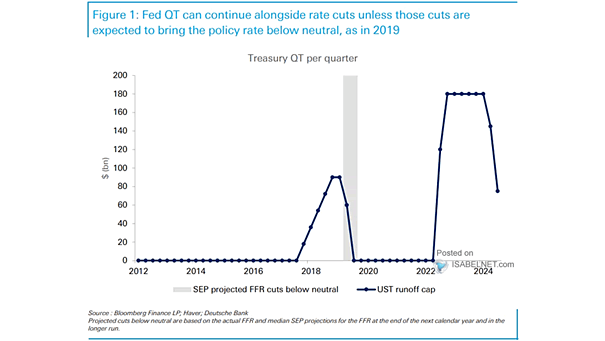
Treasury QT The current context suggests that QT can continue even as the Fed begins to cut interest rates, provided that these cuts do not push the policy rate below what is considered neutral. Image: Deutsche Bank
Treasury QT The current context suggests that QT can continue even as the Fed begins to cut interest rates, provided that these cuts do not push the policy rate below what is considered neutral. Image: Deutsche Bank
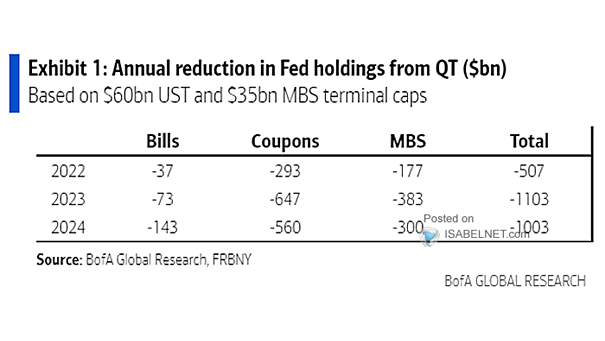
Annual Reduction in Fed Holdings from QT The Fed plans to reduce its balance sheet at an annual rate of about $1.1 trillion. Image: BofA Global Research

10Y-3M Treasury Yield Spread Adjusted for QE and QT Adjusted for quantitative easing (QE) and quantitative tightening (QT), the 10-year minus 3-month yield curve may have inverted in December 2018. Image: Morgan Stanley Wealth Management
S&P 500 – Secular Bull and Bear Markets The strong performance of the S&P 500 in 2023 and 2024 could be seen as a clear indication of a more sustained secular bull market, potentially extending until the late 2020s and early 2030s. Image: BofA Global Research Click the Image to Enlarge
Central Bank Liquidity and “Big Tech” Market Capitalizations Will QT continue to impact tech stocks? Image: BofA Global Investment Strategy
S&P 500 and Fed Balance Sheet Will QT have less impact on markets than investors expect? Image: Richardson Wealth
Why the US Stock Market Was Overvalued by 14.2% on Oct. 1, 2018 vs. 7.7% Today? Because the value of the forecast changes over time (blue dotted line). The US stock market short-term forecast (S&P 500 with dividends reinvested) for the next 12 months is available to our subscribers. This great prediction model is updated daily.…
PREMIUM MEMBERSHIP – Click the Images to Enlarge Video tutorials are available by clicking on this link: “FORECASTING MODELS” located in the menu bar at the top of each page. Our daily Stock Market Bull and Bear Indicator is available in the Pro Membership. Upgrade your Premium Membership to a Pro Membership Now! The period of…
PRO MEMBERSHIP – Click the Images to Enlarge Video tutorials are available by clicking on this link: “FORECASTING MODELS” located in the menu bar at the top of each page.
BASIC MEMBERSHIP – Click the Images to Enlarge Video tutorials are available by clicking on this link: “FORECASTING MODELS” located in the menu bar at the top of each page. Our daily Stock Market Bull and Bear Indicator is available in the Pro Membership. Upgrade your Basic Membership to a Pro Membership Now! The period of…
Advanced Stock Market Forecast 95% Correlation since 1970 Stock Market Valuation Short- and Long-Term Forecasts Bull and Bear Indicator Equity Risk Premium R² = 0.90 since 1970 For Professionals and Individuals View More Subscribe Now! Check out our Stock Market Forecasting Models “Your results are very interesting” Howard Marks Legendary investor Our Features Five Advanced…