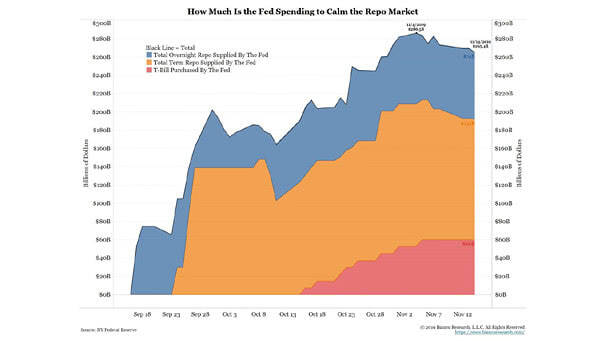
U.S. Repo Market and the Fed
U.S. Repo Market and the Fed Interesting chart showing that the Fed is pumping hundreds of billions into the repo market. Image: Bianco Research
U.S. Repo Market and the Fed Interesting chart showing that the Fed is pumping hundreds of billions into the repo market. Image: Bianco Research
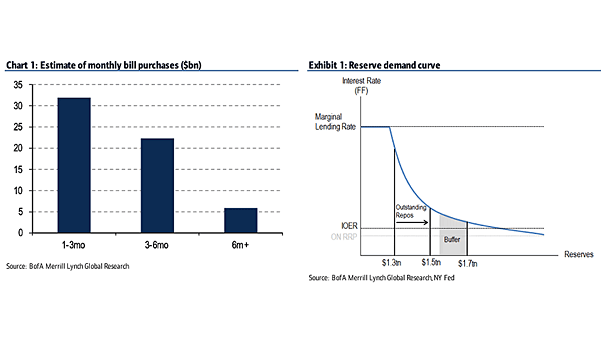
Repo Market (Outstanding Repos) and Reserve Demand Curve The Fed will expand its balance sheet again, by purchasing Treasury bills at least until mid-2020, which should rebuild the level of reserves in the system to $1.7 trillion. Image: BofA Merrill Lynch

Percent of S&P 500 Market Cap Reporting Earnings With a significant number of S&P 500 companies set to report their earnings shortly, market participants will be closely monitoring these results for indications of economic health and sector-specific performance. Image: Goldman Sachs Global Investment Research
U.S. Labor Market – NFIB Small Business Job Openings Hard to Fill U.S. job openings rose to a two-year high, as small businesses report difficulty filling jobs. Image: BofA Global Investment Strategy
S&P 500 Price Return and S&P 500 as Reported EPS Equity markets tend to follow the EPS trend. Image: Nordea and Macrobond
How Has the Value of the Stock Market Changed since the Beginning of the Year? This chart suggests that most Americans are not aware of market movements. Only 40% of respondents reported that the value of the stock market has increased this year. Image: Financial Times
Warren Buffett Talks Investment Strategy and Mastering the Market “Well, I look at a lot of figures just in connection with our businesses. I like to get numbers. So I’m getting reports in weekly in some businesses, but that doesn’t tell me what the economy’s going to six months from now or three months from…
NAAIM Exposure Index – Investor Sentiment The current 99.30 reading reflects active managers’ strong bullish stance and significant exposure to the U.S. stock market, signaling robust confidence but also caution for potential market volatility ahead. The National Association of Active Investment Managers Exposure Index represents the two-week moving average exposure to U.S. equity markets reported by NAAIM…
S&P 500 Total Return and U.S. High Yield/High Grade Usually, flight to quality in credit markets is rarely a good sign for equities, but ECB QE, Fed easing and repo operations should be positive. Image: BofA Merrill Lynch