NAAIM vs. S&P 500 Index
NAAIM vs. S&P 500 Index A tradeable rally may be forming, as NAAIM members are bearish. Image: Real Investment Advice
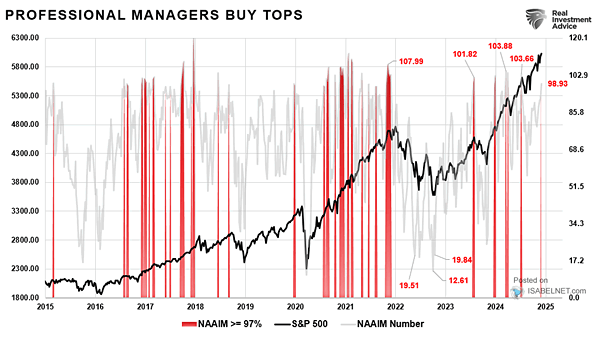
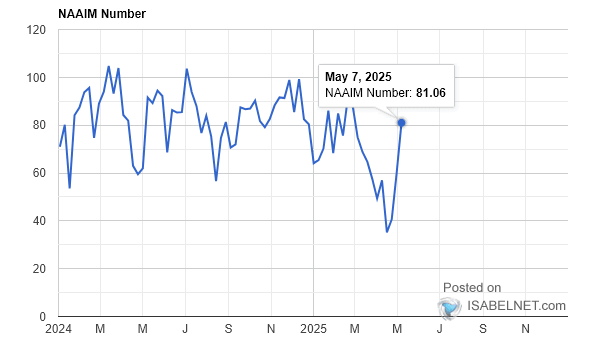
NAAIM Exposure Index – Investor Sentiment The National Association of Active Investment Managers Exposure Index represents the two-week moving average exposure to U.S. equity markets reported by NAAIM members. The NAAIM Exposure Index stands at 24.31%. NAAIM members are bearish. Image: National Association of Active Investment Managers (NAAIM)
NAAIM Exposure Index and S&P 500 Index Asset Manager/Institutional Short Futures Only Open Interest Is the U.S. stock market ripe for a correction? Image: BCA Research
NAAIM 4-Week Average vs. S&P 500 Index U.S. active managers are extremely bullish, as allocation levels are near extremes. Image: Real Investment Advice
NAAIM – Equity Exposure of U.S. Active Managers U.S. active managers are optimistic, as they have the highest level of exposure to equities in over two years, betting on a rebound in global growth. Image: Morgan Stanley Research
Investor Sentiment – NAAIM Exposure Index and S&P 500 NAAIM Exposure Index dropped to 56.15% (median exposure at 70%). NAAIM members’ optimism was short-lived. Image: Willie Delwiche, Baird