U.S. Trade-Weighted Dollar and Twin Deficits as % of GDP (Leading Indicator)
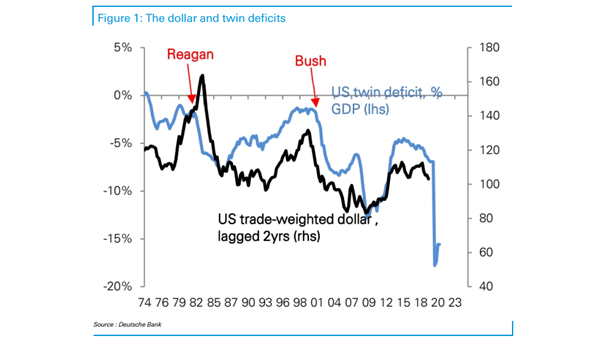
U.S. Trade-Weighted Dollar and Twin Deficits as % of GDP (Leading Indicator) Historically, the twin deficits tend to lead the U.S. dollar by two years. Image: Deutsche Bank
U.S. Trade-Weighted Dollar and Twin Deficits as % of GDP (Leading Indicator) Historically, the twin deficits tend to lead the U.S. dollar by two years. Image: Deutsche Bank
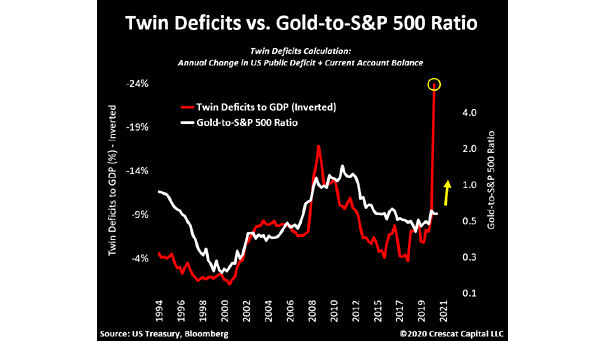
Twin Deficits vs. Gold-to-S&P 500 Ratio U.S. twin deficits suggest that gold could outperform the S&P 500. Image: Crescat Capital LLC

U.S. Twin Deficits (% of GDP) Lead the U.S. Dollar Broad REER by 18 Months The chart suggests that the U.S. dollar should weaken over time. You may also like “U.S. Twin Deficits (% of GDP) Lead Real Trade Weighted Dollar Index by Two Years” and “U.S. Dollar and Relative Growth (GDP Spread)” and “U.S. Budget…
U.S. Twin Deficits (% of GDP) Lead Real Trade Weighted Dollar Index by Two Years The chart suggests that the U.S. dollar should weaken over time. Image: Strategas
U.S. Twin Deficits: Budget & Trade May Trump’s fiscal gamble not pay off? Meanwhile, the U.S. twin deficits continue to grow. Image: LPL Research
U.S. Budget Deficits and the U.S. Dollar Pretty good correlation between U.S. budget deficits and the U.S. dollar over the past 30 years. The chart suggests that the U.S. dollar should weaken over time. You may also like “U.S. Twin Deficits (% of GDP) Lead Real Trade Weighted Dollar Index by Two Years” and “U.S. Dollar…
U.S. Dollar and Relative Growth (GDP Spread) The chart shows that the U.S. Dollar REER is about relative growth (U.S. GDP – Other Developed Market GDP YoY). You may also like “U.S. Twin Deficits (% of GDP) Lead Real Trade Weighted Dollar Index by Two Years” and “U.S. Twin Deficits (% of GDP) Lead U.S.…
Dollar Index vs. MSCI Emerging Markets Relative Performance Interesting chart showing the correlation of -0.89. Emerging markets could soar if the U.S. dollar falls. You may also like “Twin Deficits (% of GDP) Lead Real Trade Weighted Dollar Index by Two Years.” Image: Paolo Cardena