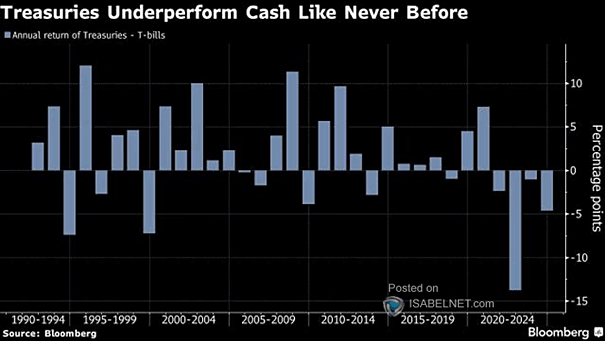
U.S. 1-Month T-Bill Yield

U.S. 1-Month T-Bill Yield U.S. Treasury bills (T-bills) have been hit by concerns over the U.S. debt ceiling. A default by the U.S. government on its debt would have serious and prolonged financial and economic effects. Image: BofA Global Investment Strategy

T-Bill Market – Treasury Bills

T-Bill Market – Treasury Bills Since March 2020, the T-bill market has doubled in size amid strong demand. Image: J.P. Morgan

Seasonality – S&P 500 % Change

Seasonality – S&P 500 % Change As cash and T-bills currently offer an attractive yield, should investors “sell in May and go away” this year? Image: TS Lombard

10Y-3M Yield Curve Inversion and S&P 500 Operating EPS

10Y-3M Yield Curve Inversion and S&P 500 Operating EPS The inversion of the yield curve between 3-month and 10-year Treasurys is not good news for S&P 500 operating EPS  (90D means 3-month T-bill). The 50 day moving average removes false signals since 1967. Image: Stifel