Fed Funds Rate – Target Probabilities at the Fed’s FOMC Meeting
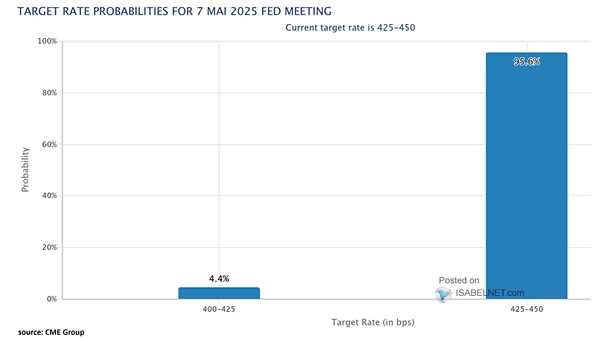
Fed Funds Rate – Target Probabilities at the Fed’s FOMC Meeting Traders show little optimism for a Fed rate cut at the July 30, 2025 FOMC meeting, with market expectations assigning just a 4.7% probability of a 25 bps reduction. Image: CME Group