Average S&P 500 Performance Around Bear Markets and Corrections
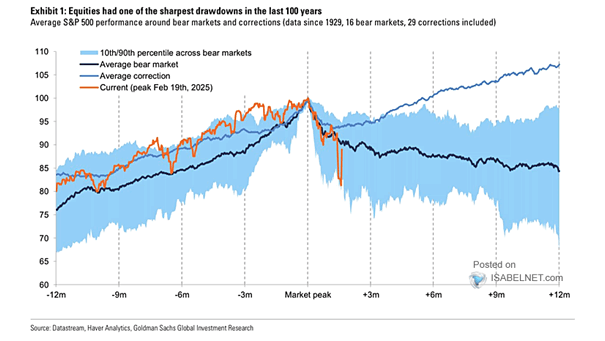
Average S&P 500 Performance Around Bear Markets and Corrections The current drawdown in the S&P 500 has been notably sharper compared to the average bull market correction, aligning more closely with the characteristics of an average bear market. Image: Goldman Sachs Global Investment Research