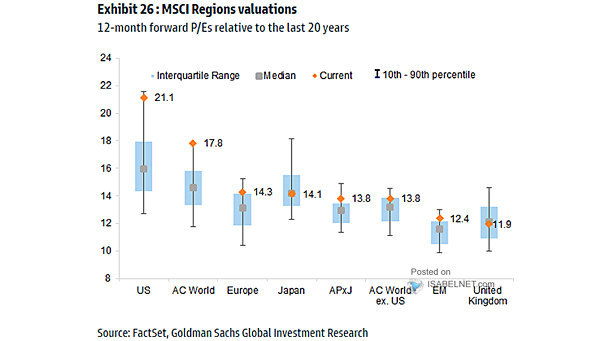
Valuation – 12-Month Forward P/E Ranges (MSCI Regions)
Valuation – 12-Month Forward P/E Ranges (MSCI Regions) High valuations in U.S. and global equity markets today often indicate a risk of lower future returns, unless earnings growth accelerates enough to justify these prices. Image: Goldman Sachs Global Investment Research