Coronavirus Momentum
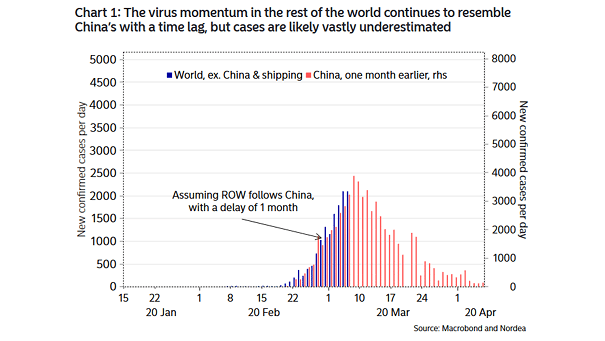
Coronavirus Momentum This chart suggests that the coronavirus momentum may fade next week, as the daily new coronavirus cases outside of China resemble the Chinese outbreak with a lag of one month. Image: Nordea and Macrobond
Coronavirus Momentum This chart suggests that the coronavirus momentum may fade next week, as the daily new coronavirus cases outside of China resemble the Chinese outbreak with a lag of one month. Image: Nordea and Macrobond
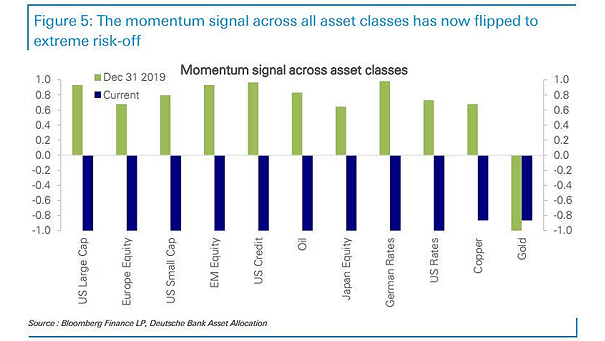
Momentum Signal Across Asset Classes Momentum signals across all asset classes have flipped to extreme risk-off. Image: Deutsche Bank Asset Allocation

Global Equity Market Sentiment Index vs. Global Economic Growth Momentum If the global equity market sentiment index remains below zero, it could suggest a slowdown in economic momentum. Image: Nomura
Momentum to Value Rotation The rotation into value suggests a rebound in global economic growth, not a recession. Image: BofA Merrill Lynch US Equity & US Quant Strategy
Correlation Between Value and Momentum The correlation between value and momentum is near record lows. Below this level, value outperformed momentum over the next 250 days (77% of the time) since 1986. Image: BofA Merrill Lynch US Equity & US Quant Strategy
Valuation – Value vs. Momentum Stocks Chart suggesting that value stocks are currently very cheap vs. momentum stocks. The relative forward P/E of value vs. momentum is at two standard deviations below the average. Image: BofA Merrill Lynch US Equity & Quant Strategy
Growth, Momentum, Volatility and Value Factor Performance Chart showing that value stocks make a comeback as momentum and growth stocks get hammered. Image: Goldman Sachs Global Investment Research
S&P 500 and Number of Days Above 20-Day Moving Average While the S&P 500’s extended period above its 20-day moving average signals strong momentum, historical patterns and technical indicators point to a potential pullback or consolidation ahead. Image: SubuTrade
S&P 500 Performance After Green in Both May and June Since 1988, when the S&P 500 gains in both May and June—a rare bullish sign—the rest of the year rose 15 of 16 times, averaging 8.8% gains, indicating strong momentum and positive investor sentiment for the year’s second half. Image: Carson Investment Research
S&P 500 2025 Target JPMorgan has reversed its previously cautious stance on the U.S. stock market, raising its year-end 2025 S&P 500 Index target from 5,200 to 6,000, driven by strong fundamentals, tech sector momentum, and easing trade concerns. Image: Bloomberg
S&P 500 – 13-Week and 26-Week Moving Average The S&P 500 continues to exhibit a negative medium-term trend, as shown by moving average crossover signals. Specifically, the 13-week moving average is below the 26-week moving average and is still declining, which usually points to persistent bearish momentum. Image: Bloomberg