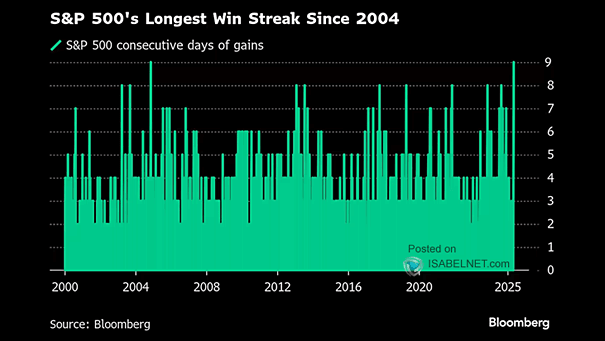
S&P 500 Consecutive Days of Gains
S&P 500 Consecutive Days of Gains Although there are valid reasons for caution, the U.S. stock rebound is driven by strong momentum. Historically, momentum-driven rallies tend to persist longer than expected, even during major macroeconomic challenges. Image: Bloomberg