Valuation – Fed Rate Hikes vs. S&P 500 P/E
Valuation – Fed Rate Hikes vs. S&P 500 P/E Is the U.S. stock market facing strong headwinds at the start of the Fed’s hiking cycle? Image: BofA Global Investment Strategy
Commercial and Industrial Loans of U.S. Banks as % of GDP vs. Deliquency Rate Is the end of the U.S. credit cycle near? The delinquency rate remains low, while U.S. business loans are close to previous highs. Image: Pavilion Global Markets
S&P 500 Index: Recession Rate Cuts vs. Precautionary Rate Cuts This chart shows what the U.S. market has done after first Fed cut in a business cycle. The current path follows precautionary rate cuts and does not suggest an imminent recession in the U.S.. Image: UBS
S&P 500 Performance Leading to U.S. Election Date This table shows that over the last 20 election cycles in the U.S., there have been only two instances of market declines in the 12 months leading to the election results. Image: J.P. Morgan Asset Management
S&P 500 Total Return Change During Economic Expansions The current business cycle is the longest and weakest expansion. The next downturn could hit the U.S. stock market much harder than the economy. Image: Irrelevant Investor LLC
Expected Fed Funds Rate as of June 20, 2019 Fed funds futures for January 2021 imply an expected rate of only 1.26% (traders are pricing in more than four full cuts). You may also like “Markets Have Accurately Priced in Cuts before Easing Cycles Begin.”
Fed Monetary Policy Rate Change over 6 Months Prices in (Futures) vs. Actual Actually, the Fed decides when to raise rates, but the market decides when to cut rates. This chart shows that rate expectations are highly predictive six months in advance. You may also like “Markets Have Accurately Priced in Cuts before Easing Cycles…
Lower Returns for Stocks in the Next 12 Months? Morgan Stanley’s cyclical indicator is flagging “downturn.” The yield curve’s slope, debt issuance, consumer confidence, economic and financial markets data are aggregated in Morgan Stanley’s cyclical indicator. The entry into the “downturn” phase suggests lower returns for stocks and risky assets in the next 12 months. Image:…
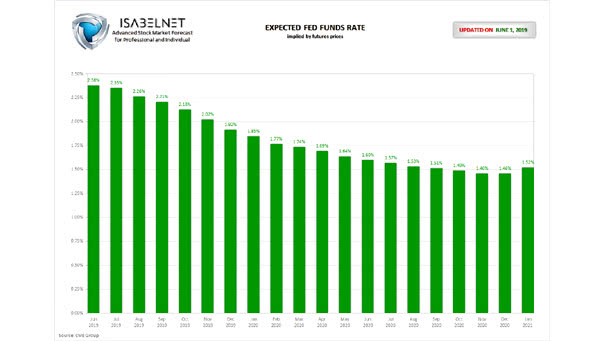
Expected Fed Funds Rate as of June 1, 2019 Traders are pricing in two full cuts in the fed funds target before the end of 2019. Fed funds futures for January 2020 imply an expected rate of only 1.85%. Let’s hope the Fed gets the message from the market. You may also like “Markets Have…
“Real Fed Rates Are the Most Accurate Predictor of Future S&P 500 Volatility,” Says SocGen SocGen says it is the most accurate predictor of S&P 500’s volatility over the last 50 years. Should investors be nervous about rising real interest rates? Yes, higher real interest rates mean higher borrowing costs. Real Fed funds rate is…
US Yield Curve Inversion and Recessions This interesting chart shows the US yield curve inversion (10y-2y spread) and recessions. Historically, by ending the rate hiking cycle before an inversion, the expansion has still some legs and the next recession is postponed. Source: J.P. Morgan Asset Management “Guide to the Markets” for Q2 2019