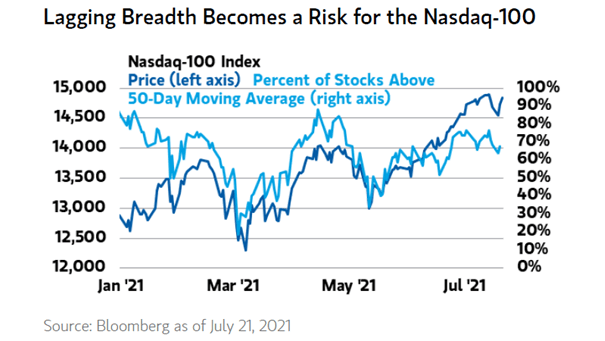
S&P 500 and % of Stocks Above 50-Day Moving Averages

S&P 500 and % of Stocks Above 50-Day Moving Averages Based on the percentage of stocks above 50-day moving averages, market breadth has weakened. Should investors be worried? Image: BofA Global Research

S&P 500 – 2020 vs. 2009

S&P 500 – 2020 vs. 2009 This chart suggests that the S&P 500 is following the 2009 pattern and market breadth. Image: Morgan Stanley Research

% of S&P 500 Members Above 200-Day Moving Average

% of S&P 500 Members Above 200-Day Moving Average This chart shows that breadth across stocks and sectors had been weakening, even though the S&P 500 was climbing to new highs. Image: Deutsche Bank Asset Allocation