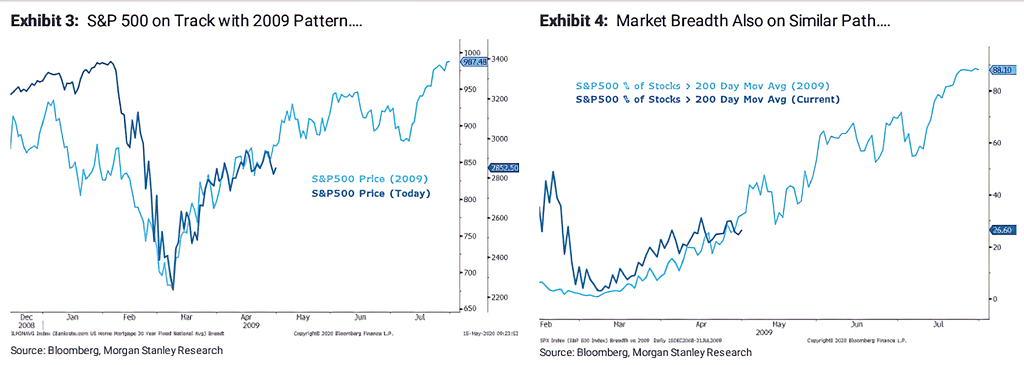
May 19 2020 Off S&P 500 - 2020 vs. 2009 This chart suggests that the S&P 500 is following the 2009 pattern and market breadth.Image: Morgan Stanley Research